Recording Quality EEG#
This guide will help you set up and verify your EEG signals using the BioAmp Hardware and Chords software.
Step 1: Skin Preparation#
Proper skin preparation is crucial before recording any biopotential signal, whether it is Electrocardiography (ECG), Electromyography (EMG), Electroencephalography (EEG), or Electrooculography (EOG). It helps to:
Clean the skin surface
Reduce electrode-skin impedance
Improve overall signal quality
Note
Need help with skin prep? Check out the full guide here: Skin Preparation Guide
Step 2: Connecting BioAmp Cables to the Hardware#
Connect the BioAmp cables to the appropriate input channels of your EEG device. Make sure the ground and reference electrodes are securely connected to the body.
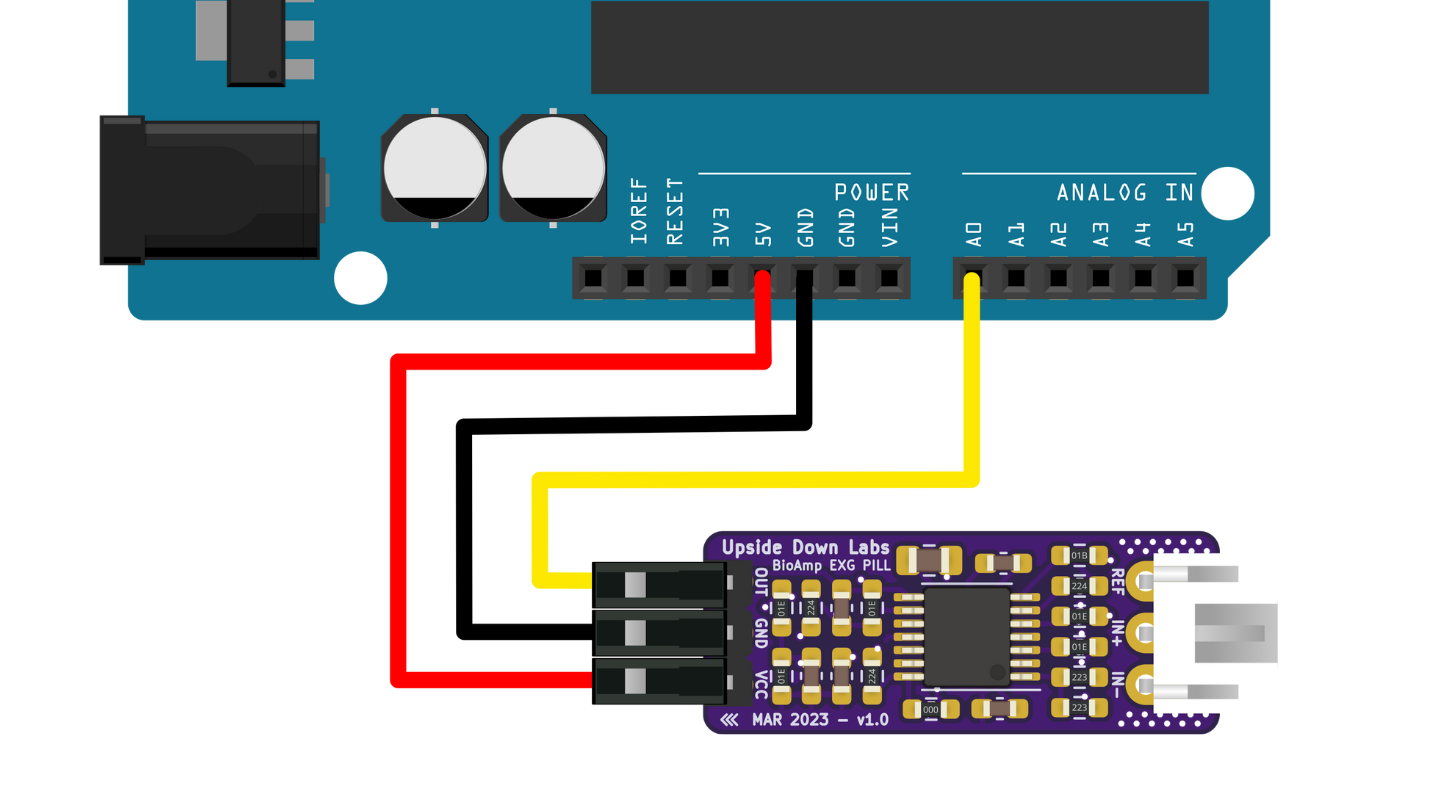
BioAmp hardware connection#
Step 3: Attaching Gel Electrodes on Targeted Areas#
Place the gel-based electrodes firmly on the targeted scalp regions—typically the frontal (e.g., Fp1, Fp2) or occipital (e.g., O1, O2) lobes—depending on your signal of interest. Ensure that the electrodes have good skin contact and are not loose.
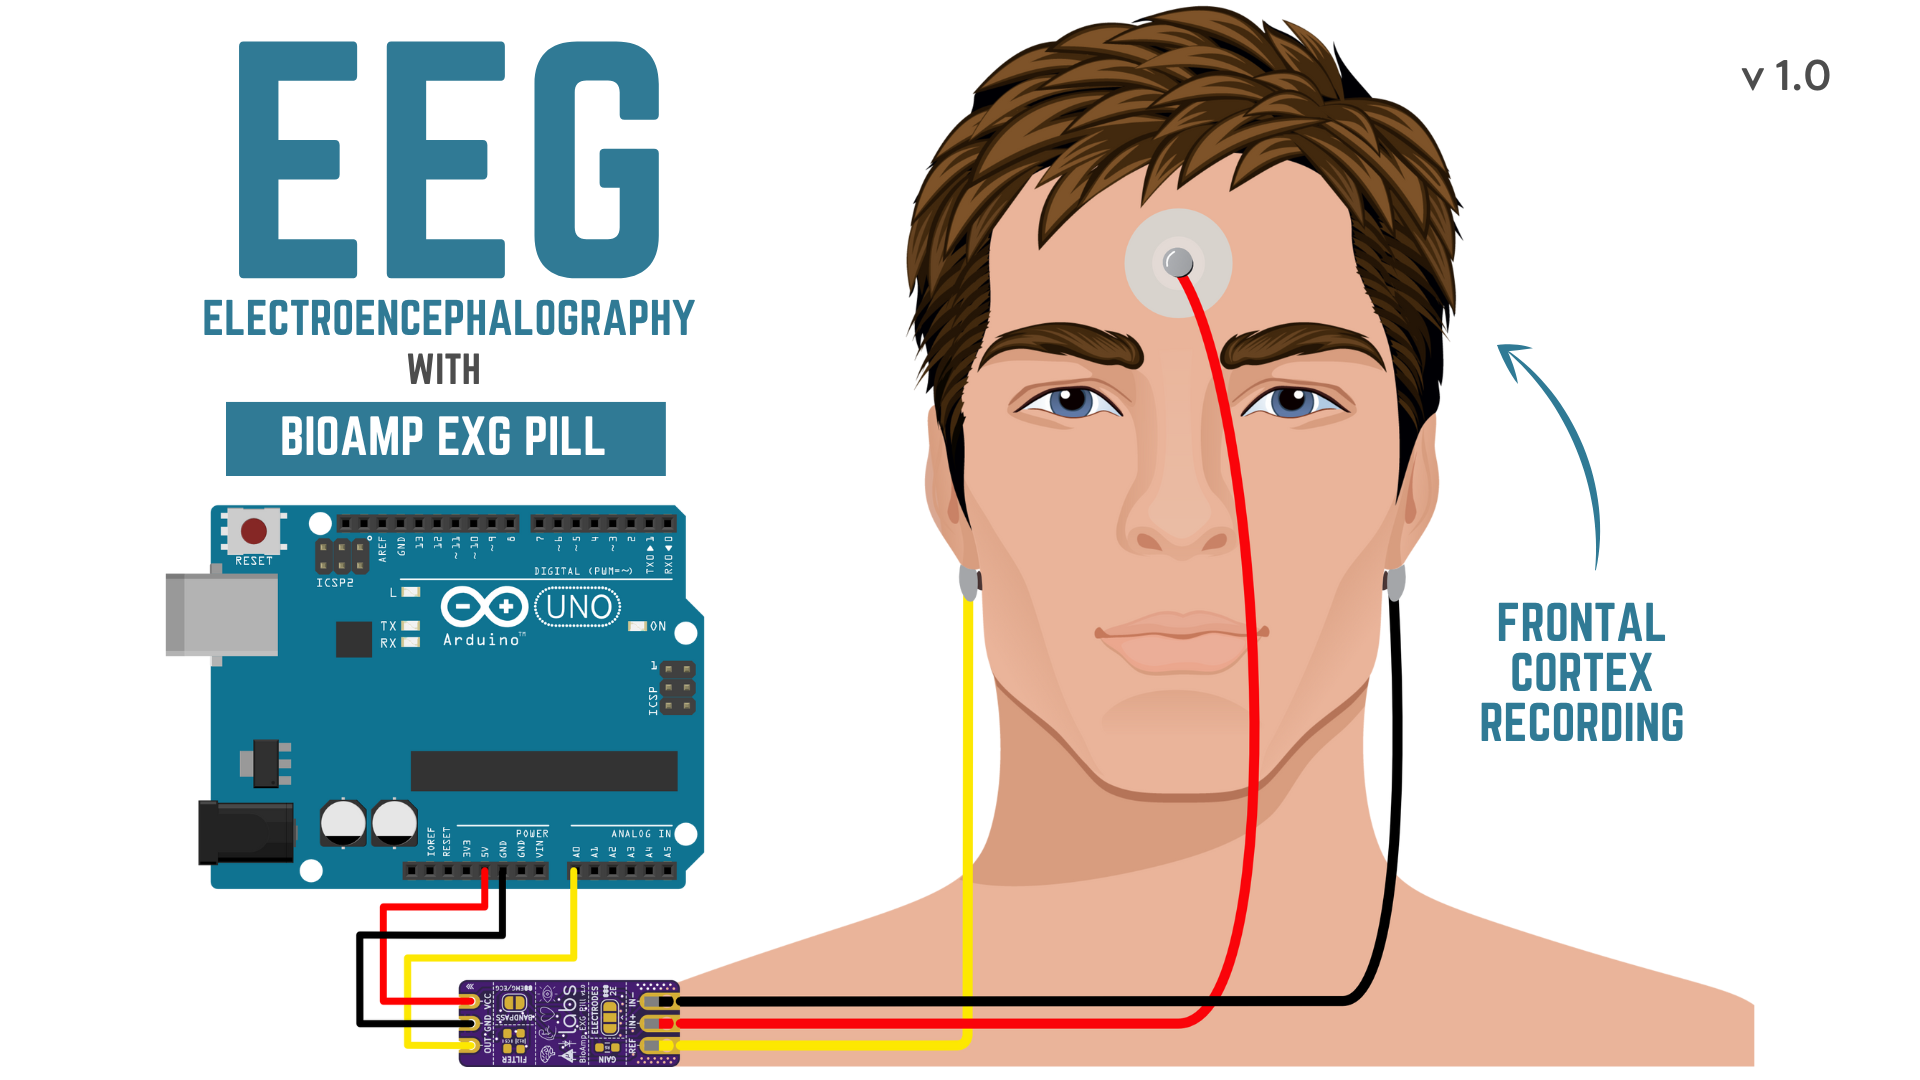
EEG gel electrode placement#
Step 4: Open Chords Software to Visualize Signals#
Open a Chromium-based browser such as Google Chrome, Microsoft Edge, Opera, or Brave.
Click on the Visualize Now button on the home page and then click on the Chords-Visualizer button on the next page.
Connect your device via Serial by selecting your device’s port.
Begin real-time visualization of your EEG signals.
Step 5: How to Check Whether the Signals Are Correct#
To verify correct electrode placement and good signal quality, try the following actions and observe their expected EEG responses.
Eye Blinks
Blinking creates sharp spikes in the EEG signal - these are EOG artifacts caused by eye movements.
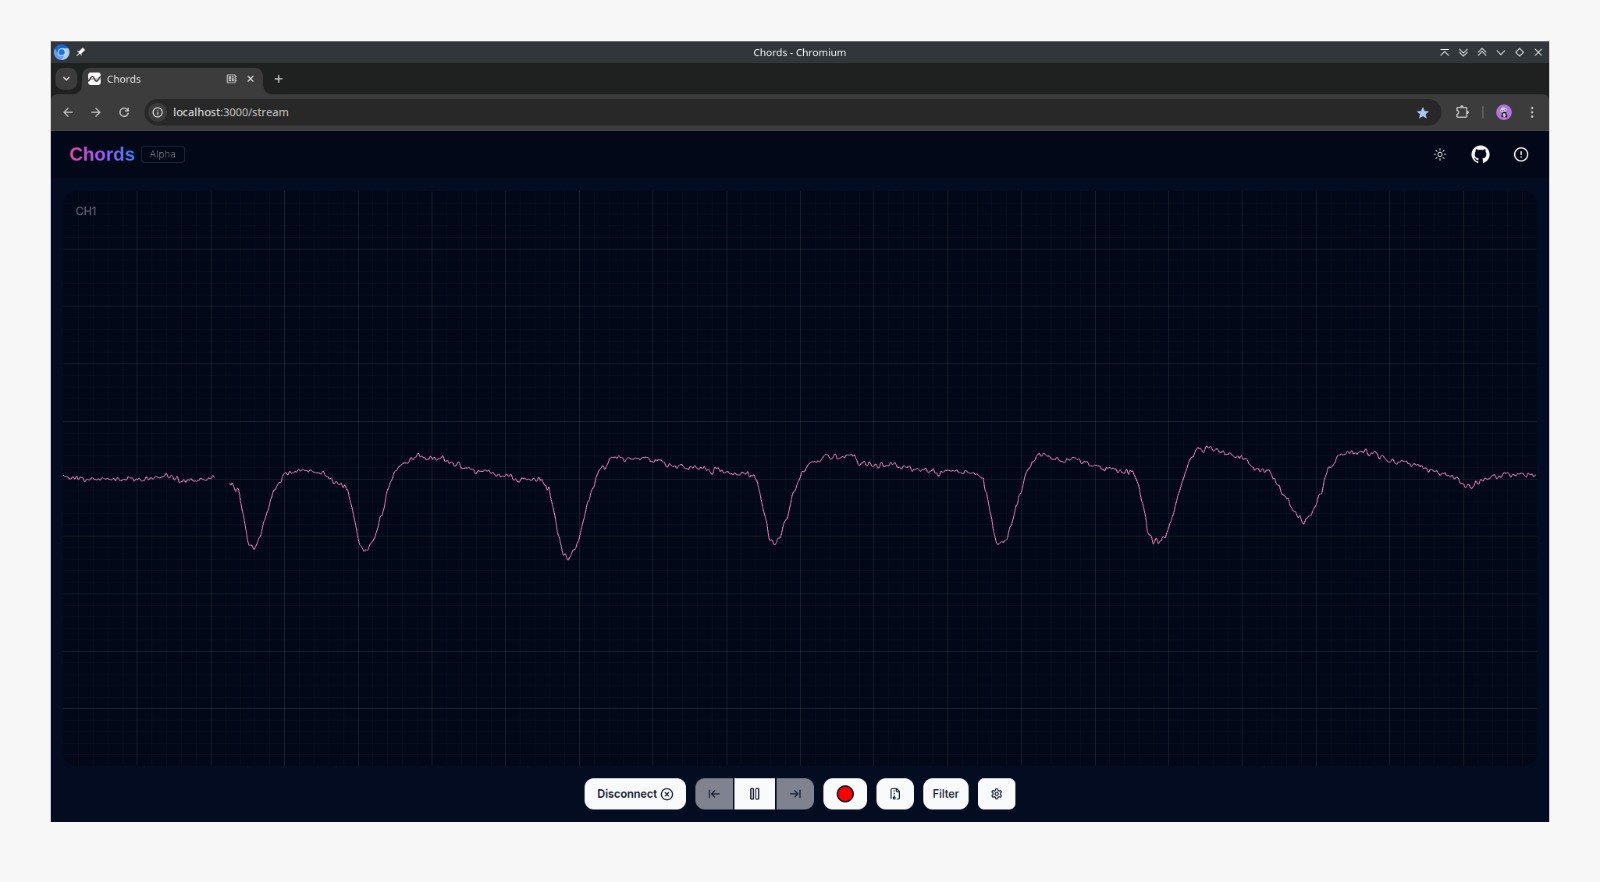
Eye blink waveform#
Jaw Clench
A strong jaw clench produces EMG artifacts in the EEG signal - these are due to facial muscle activity.
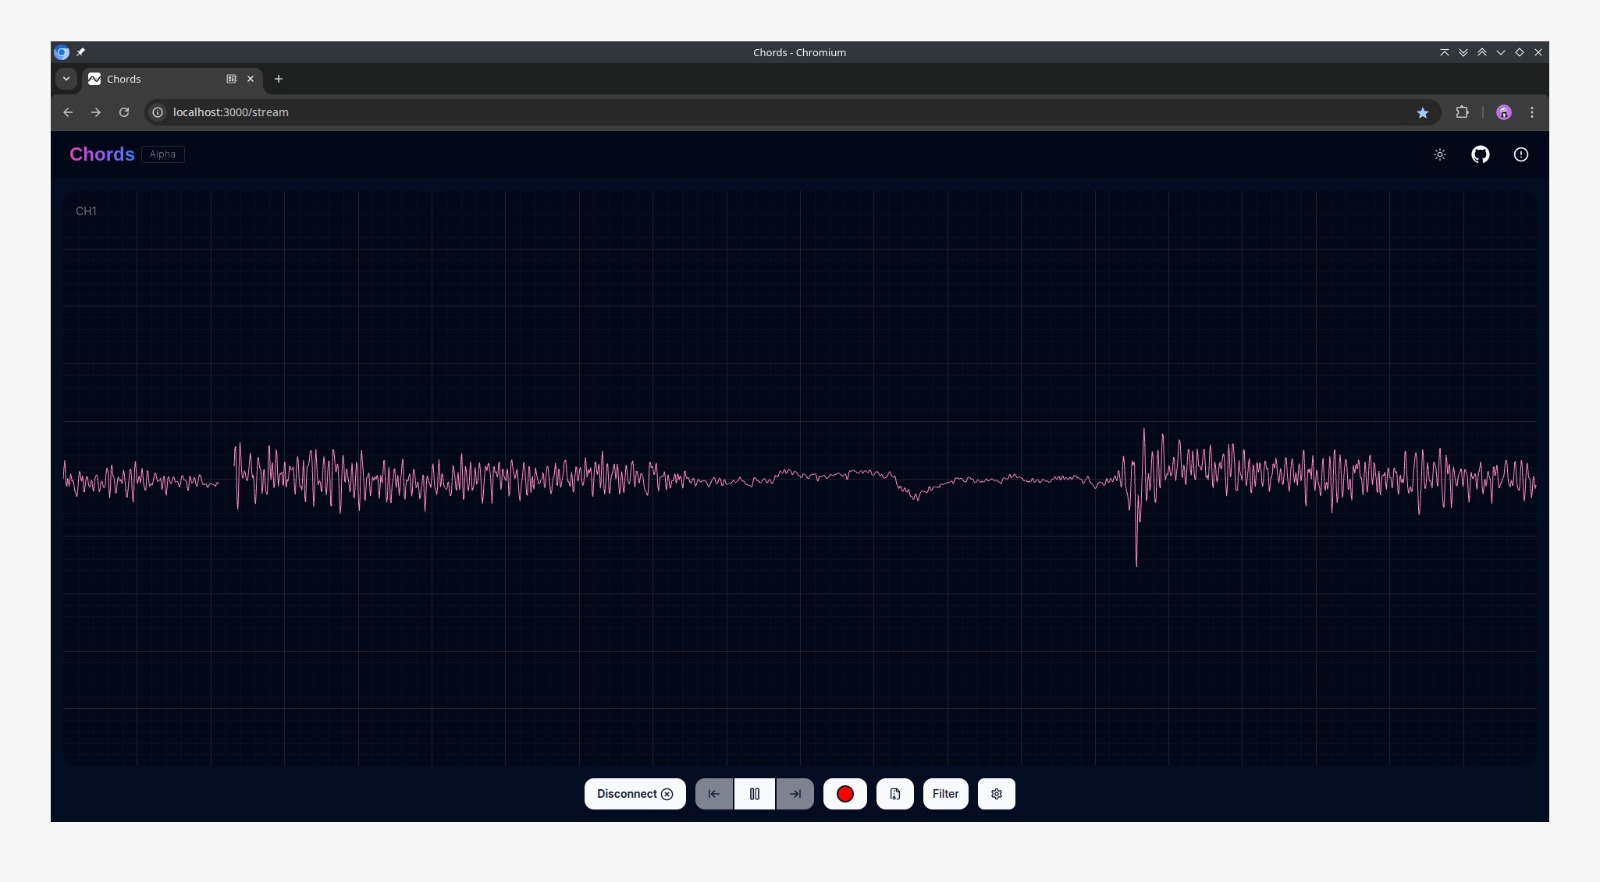
Jaw clench waveform#
Alpha Waves (Eyes Closed)
Note
This may or may not be easily observable for all users.
Close your eyes and relax. We’re recording EEG from the frontal cortex to observe alpha waves (8–12 Hz), which appear more clearly when you’re calm.
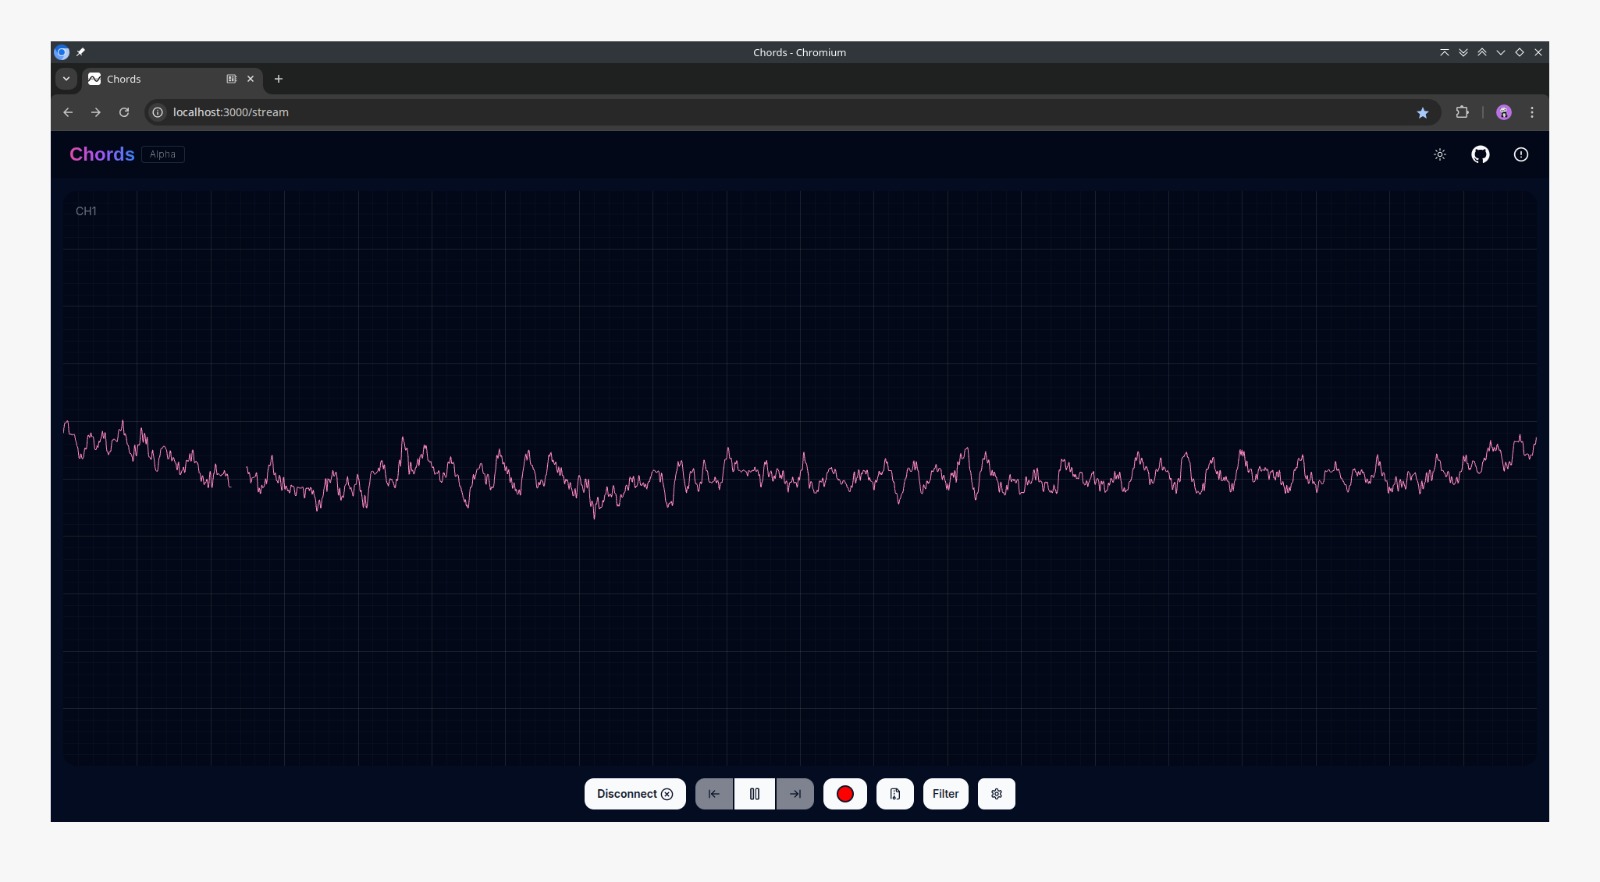
Alpha waves EEG#
Beta Candle Test
Note
This may or may not be observable for all users.
To try this: Open Chords Software → Chords Visualizer → FFT Visualizer → Connect your device (Serial/Bluetooth). Then, activate the Beta Candle feature. Focus deeply on the candle. As your focus increases, the candle’s brightness and numerical value should increase. When you defocus, the value drops and the candle dims or blows out.
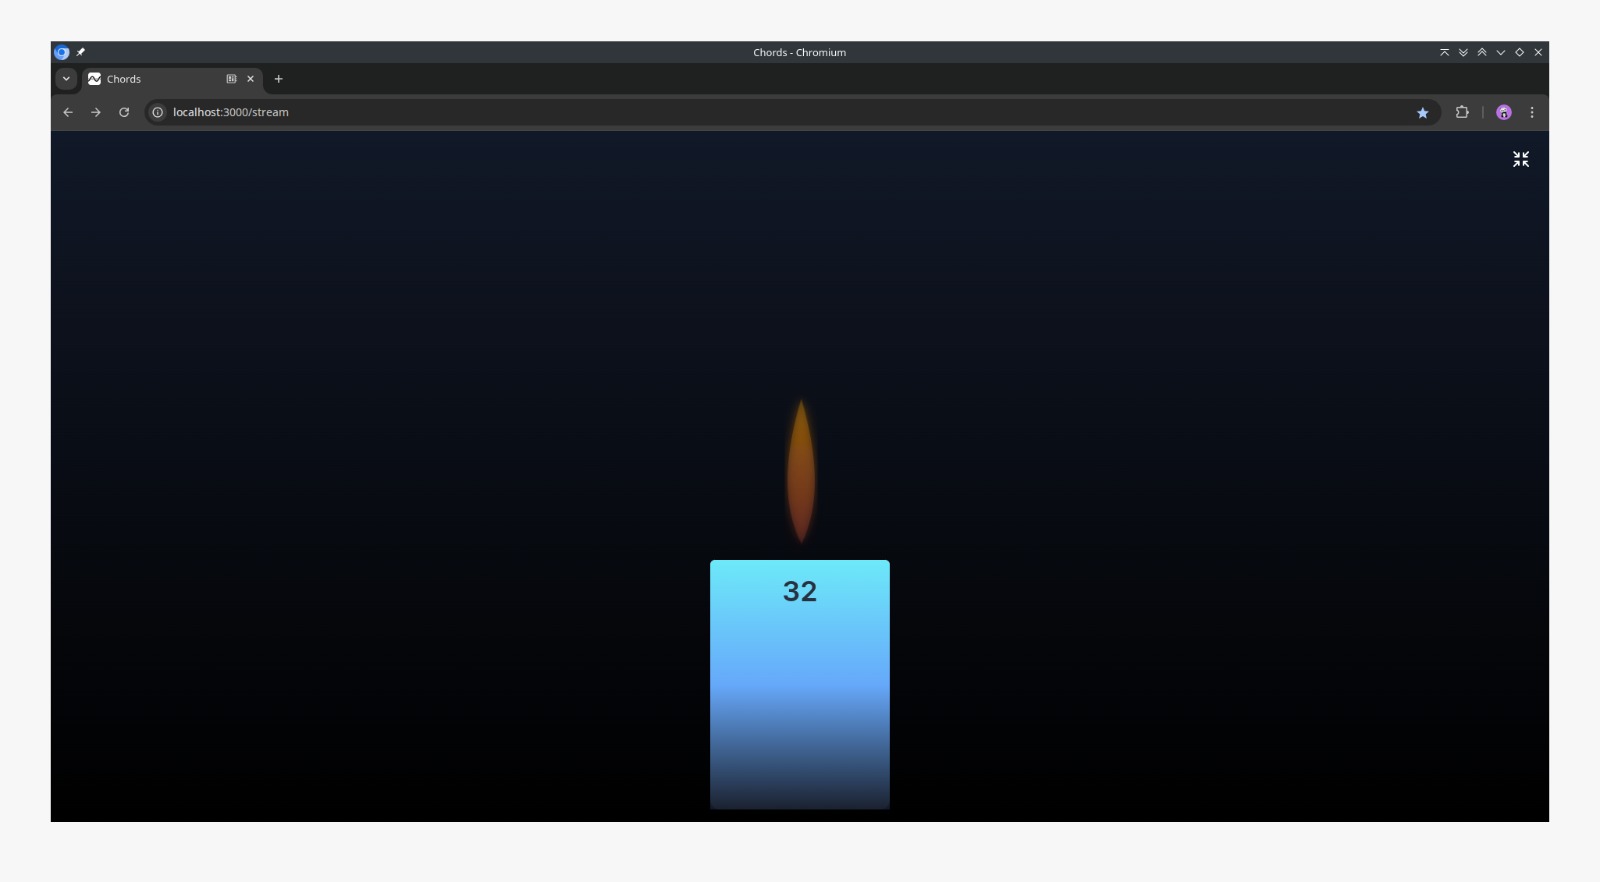
Beta candle test#
If all or most of these responses are clearly visible, your setup is correct, and your EEG signals are stable enough for analysis.