Technical Documentation#
Software Used#
Before using the BioAmp Visualizer, ensure you have the following software installed:
Arduino IDE:
Purpose: The Arduino Integrated Development Environment (IDE) is essential for writing and uploading sketches (code) to your Arduino development board.
Download: You can download the Arduino IDE from the official Arduino website.
Compatible Web Browser:
The BioAmp Visualizer is compatible with the of the following web browsers:
Google Chrome
Microsoft Edge
Opera
Hardware Used#
To use the BioAmp Visualizer, you need the following hardware:
USB Cable:
Purpose: The USB cable is used to connect your Arduino board to your computer for power supply and data transfer.
Type: The type of USB cable required depends on your specific Arduino board model:
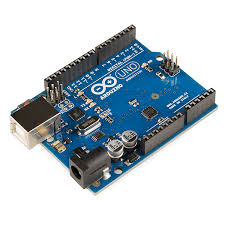
Arduino Uno: Typically uses a USB Type-A to USB Type-B cable.
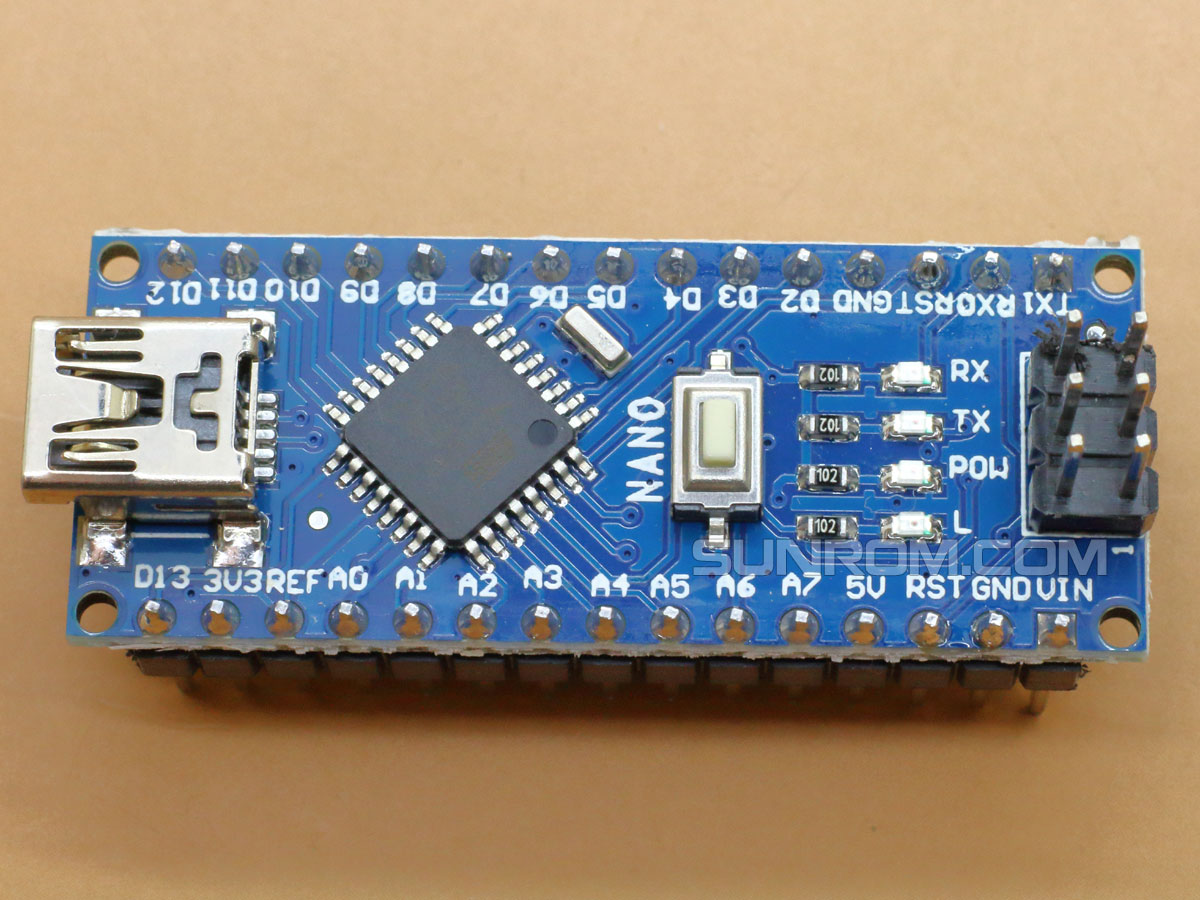
Arduino Nano: Typically uses a USB Mini-B cable or a Micro-USB cable (depending on the Nano version).
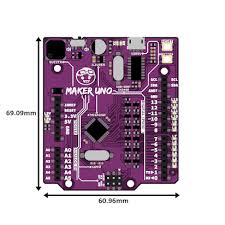
Maker Uno: Typically uses a USB Type-A to USB Type-B cable.
Compatible Arduino Boards:
The following Arduino boards are compatible with the BioAmp Visualizer:
Arduino Uno: A popular choice for beginners and widely supported.
Arduino Nano: A smaller, compact version of the Uno with similar functionality.
Maker Uno: A variant of the Uno designed for educational purposes, often used in maker projects.
Board |
Name |
|---|---|
|
Arduino Uno |
|
Arduino Nano |
|
Maker Uno |
Ensure you have all the necessary software and hardware components ready before starting with the BioAmp Visualizer to ensure a smooth setup and usage experience.
Why Chromium Based Browsers#
The web application relies on the Web Serial API to function correctly. This API enables web applications to communicate with serial devices directly from the browser.
Currently, the Web Serial API is supported by the following browsers:
Google Chrome
Microsoft Edge
Opera
If your browser does not support this API, the application will display a message informing you of the incompatibility and suggesting the use of a supported browser.
The web application ensures that your browser supports the Web Serial API. If your browser is not compatible, a message like below will be displayed informing you of the issue.
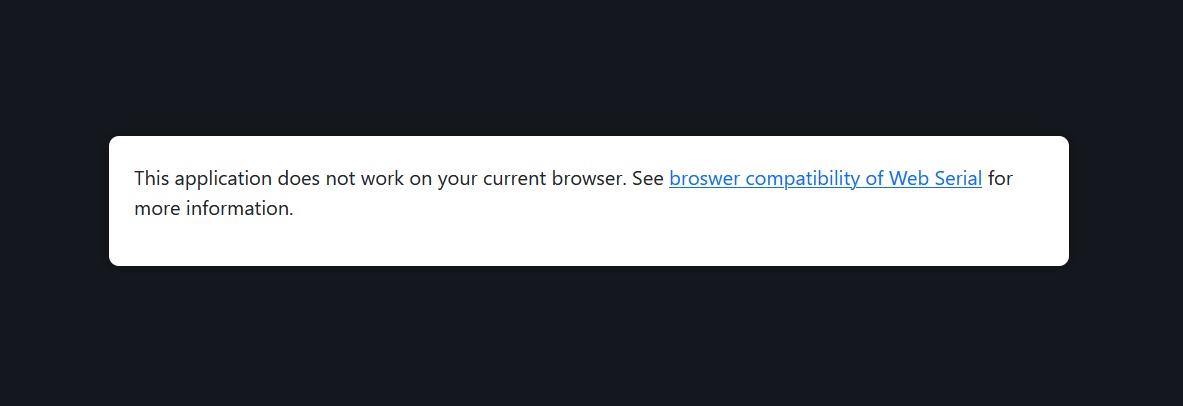
Non Compatibility Message#
For more detailed information on browser compatibility and implementation details, refer to the MDN Web Docs on the Web Serial API.
Technical Capabilities#
1. Signal Visualization#
Purpose: We are displaying real time data from the Arduino board to the SmoothieCharts.
Multi-Channel Plotting: We are plotting data from multiple sensors or channels simultaneously. Each channel is represented by a different color on different charts, allowing users to monitor various data streams in different graphs.
Time-Series Data Representation: The data is displayed as a time series, meaning that it shows how the values change over time. This is crucial for observing patterns and analyzing the behavior of the signals.
2. Speed Adjustment#
Functionality: Users can control the speed at which the graph updates by clicking the speed button. This button toggles between two speeds: slow(20 millis/pixel) and fast(10 millis/pixel).
Visual Aids: Arrows are provided to assist users in selecting the desired speed. These arrows make it easier to understand and switch between the available speed settings, enhancing the user experience.
3. Scale Adjustment#
Auto-Scale Feature: The graph automatically adjusts its y-axis scale based on the capabilities of the connected Arduino. When auto-scale is activated via the navbar, the system queries the Arduino to determine the maximum value of its analog-to-digital converter (ADC).
Example: For an Arduino R3 with a 10-bit ADC, the maximum value is 1023. The graph’s y-axis is then scaled from 0 to 1023. This dynamic adjustment ensures that the entire range of data values is visible, optimizing the display for the specific hardware used.
4. Data Management#
Signal Recording: Users can record the data collected from the Arduino. This functionality allows for the preservation of real-time data for later analysis.
CSV File Export: Data from all channels will be exported to a CSV file. This feature is useful for detailed analysis and for research purposes. The CSV export includes comprehensive data from all channels, facilitating easy examination of the recorded data.
Technologies Used#
HTML#
Purpose: HTML provides the foundational structure for web pages. It uses elements such as headings, paragraphs, links, images, and forms to define the content and layout of a webpage.
Role in our Project: HTML is used to create the layout of our web application, including the navigation bar, modals, buttons, and containers (canvas) for charts. It defines the semantic structure and organizes the content, ensuring that all elements are properly placed and accessible.
CSS#
Purpose: CSS is used to style the visual presentation of HTML elements. It controls aspects such as layout, colors, fonts, spacing, and responsiveness.
Role in our Project: CSS is responsible for the look and feel of our web application. It ensures that the design is visually appealing and responsive, adapting the layout to different screen sizes and devices.
JavaScript#
Purpose: JavaScript adds interactivity and dynamic behavior to web pages. It allows for actions like event handling and real-time updates.
Role in our Project: JavaScript implements the core functionality of our application. It handles events like button clicks (e.g., refreshing the page, connecting, starting, recording), manages the state of the application (e.g., enabling or disabling buttons), and interacts with other components like modals.
Web Serial API#
Purpose: The Web Serial API allows web applications to access and communicate with Arduino Board directly from the web browser. This enables real-time data exchange and control of hardware like microcontrollers, sensors, and other devices that use serial communication.
Role in our Project: The Web Serial API is crucial for our application as it facilitates direct interaction with connected Arduino Board. It enables functionalities such as:
Connecting to Arduino Board: Establishes a connection with Arduino Board for data exchange.
Reading Data: Continuously reads data from the connected device, allowing real-time monitoring and processing.
Writing Data: Write data to arduino, we specifically using this for autoscale feature, when user clicks the autoscale button, web serial api writes ‘b’ charector to arduino board on which board returns the maximum value of signal it can show.
Bootstrap#
Purpose: Bootstrap is a popular front-end framework that provides a collection of pre-designed CSS and JavaScript components. It simplifies the process of creating responsive and visually appealing web interfaces.
Role in our Project: Bootstrap enhances the user interface by offering components like navigation bars, buttons and modals. It ensures that your application has a consistent look and feel and is responsive, adapting to various screen sizes. By importing Bootstrap CSS and JS, you leverage its components and styling to quickly build and customize your web application.
Link to BootstrapSmoothieCharts#
Purpose: SmoothieCharts is a JavaScript library used for creating timeseries charts and real time data visualizations.
Role in our Project: SmoothieCharts facilitates the dynamic visualization of bio potential signal data in our application. It allows for real-time updates to the chart as new data is added, providing an interactive and visually informative way to monitor the data.
Link to SmoothieChartsIndexedDB#
Purpose: IndexedDB is a low-level API for storing significant amounts of structured data within a user’s browser. It supports complex queries and transactions, making it suitable for offline storage and local data management.
Role in our Project: IndexedDB is used to store recorded data locally within the user’s browser. This enables efficient management and retrieval of data without requiring a server connection. It ensures that users can access their recorded data even when offline or when the application is restarted.
Link to IndexedDB