Brain (EEG) BioAmp Arduino Firmware#
What is Electroencephalography (EEG)?#
Electroencephalography (EEG) [1] is a method to record an electrogram of the spontaneous electrical activity of the brain. The bio potential signals detected by EEG have been shown to represent the postsynaptic potentials of pyramidal neurons in the neocortex and allocortex. It is typically non-invasive, with the EEG electrodes placed along the scalp (commonly called “scalp EEG”) using the International 10–20 system, or variations of it. Clinical interpretation of EEG recordings is most often performed by visual inspection of the tracing or quantitative EEG analysis
To know more about EEG: https://en.wikipedia.org/wiki/Electroencephalography
The International 10–20 system is a standard method for placing EEG electrodes on the scalp in relation to the brain’s cerebral cortex. Electrode positions are labeled with letters (like Fp, F, T, C, P, O, and Z for midline) and numbers (odd for left, even for right hemisphere). The “10” and “20” refer to the percentage distances between electrodes based on the size of the head. Key reference points like the nasion, inion, and preauricular points are used for accurate placement. The system helps ensure consistent, repeatable, and comparable EEG recordings. More detailed versions like the 10–10 or 10–5 systems provide higher resolution by adding extra electrodes.
To know more about International 10–20 system visit here.
Who is this for?#
Anyone who’s using the BioAmp Hardware for the very first time — whether you’re a student, hobbyist, educator or just curious. No experience needed!
👉 To learn about our BioAmp Hardware checkout the hardware page.
Step-by-Step Setup Guide#
With the hardware in your hands, you’re just a few steps away from unlocking its full potential — let’s get the software set up!
Step 1: Downloading GitHub Repository for Hardware#
This is the code your Arduino needs to read Brain (EEG) signals.
You have two easy ways to get the code that will help you read your EEG signals:
Simply Download (recommended for beginners)
Go to the GitHub page: Brain BioAmp Arduino Firmware
Click the green “Code” button > Download ZIP
Unzip the folder and save it somewhere easy to find.
Clone using Git (for tech-savvy users)
Install Git for your OS: https://git-scm.com/
Clone this GitHub repository using
git clone https://github.com/upsidedownlabs/Brain-BioAmp-Arduino-Firmware
Step 2: Application Required#
Before you start using the kit, please download or open the following:
Arduino IDE
We need Arduino IDE to upload code to your Arduino board.
Link to download IDE for your OS: https://www.arduino.cc/en/software
Chords Website
We will use Chords Website to visualize the Brain Signals!
Open this website: Chords Web
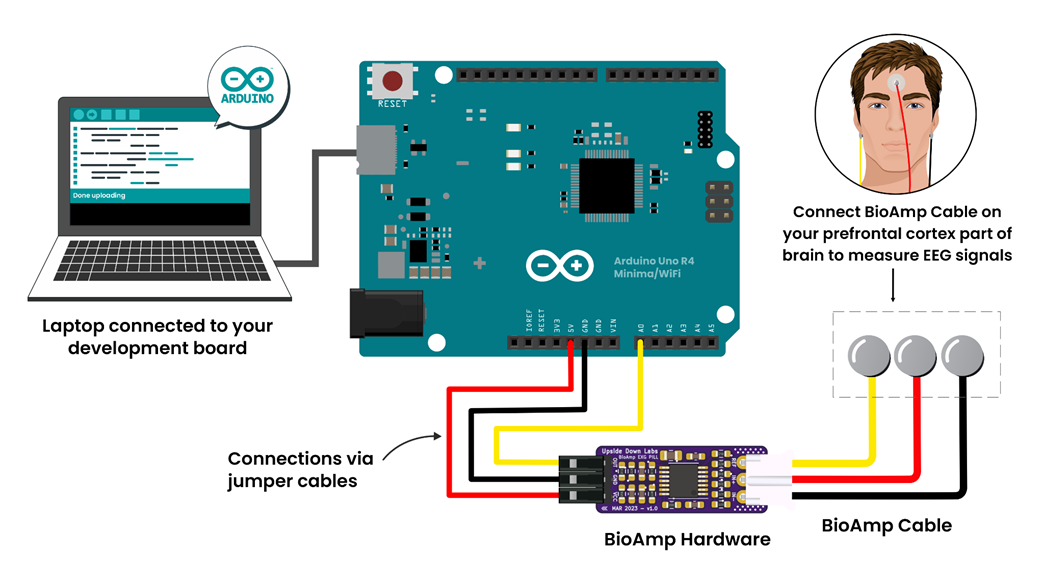
Step 3: Connect Your Hardware#
Plug the Hardware into your Arduino UNO using jumper wires.
Follow the exact wiring diagram from the hardware documentation of the hardware you are using.
Hardwares that are compatible with Brain BioAmp Firmware:
For
Fixed SamplingandEEG Filterprograms any Arduino Board can be used.
Note
For the experiments given below, you will require : Arduino UNO R4 Minima / WiFi boards
It’s just like putting together a puzzle!
Step 4: Skin Preparation and Electrodes Placement#
Using Gel Electrodes:
Prepare your skin
Choose the area where you’ll place the electrodes.
Clean the skin using an alcohol swab or Nuprep Gel to remove oils and dead cells — this improves signal clarity.
Note
Need help with skin prep? Check out the full guide here: Skin Preparation Guide
The described electrode placement isn’t universal. Always refer to the “Connect Your Hardware” section for the specific requirements of your experiment
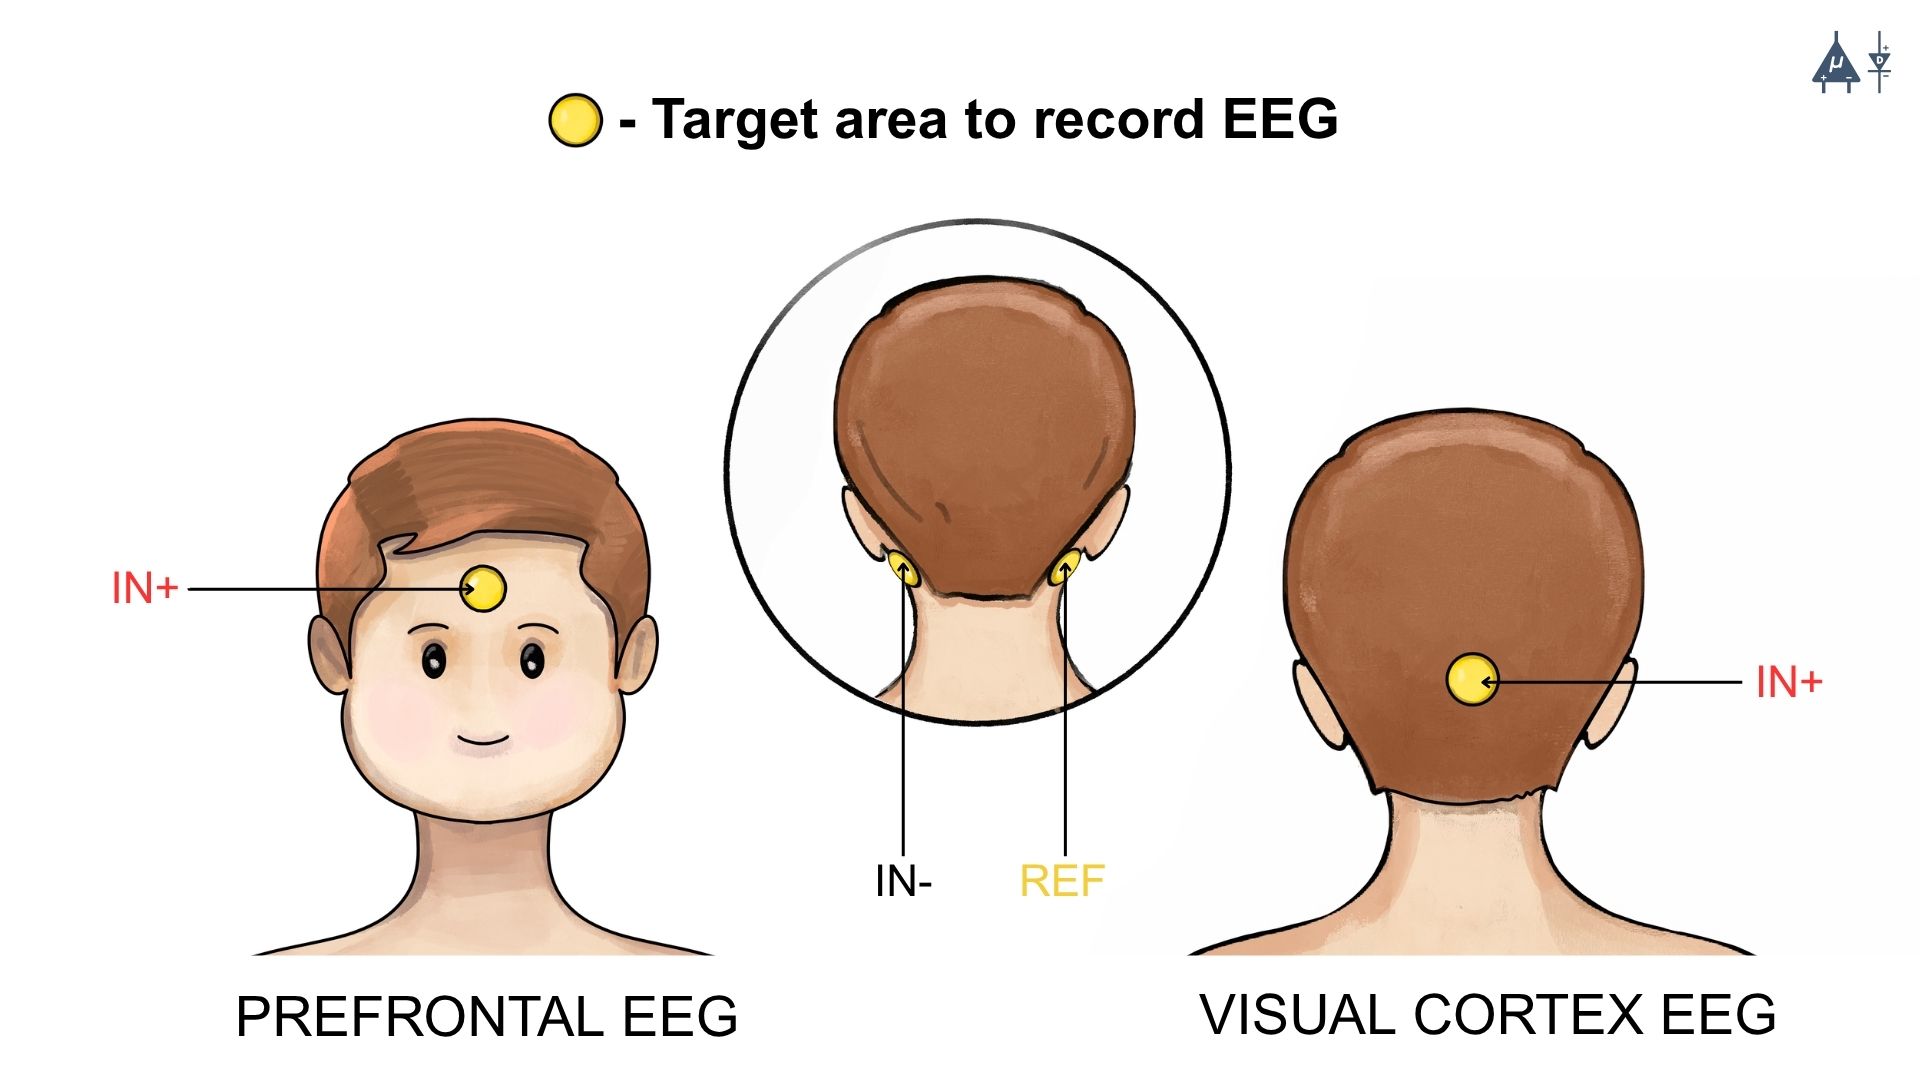
For Prefrontal EEG (for frontal brain activity), attach the wires to the electrodes, then attach the electrodes to skin (refer diagram below):
IN+(red wire): Place on center of forehead (above nose bridge).IN–(black wire): Place on left side of forehead (above left eyebrow).REF(yellow/white wire): Place behind the ear (bony area).
For Visual Cortex EEG (for back-of-brain activity), attach the wires to the electrodes, then attach the electrodes to skin (refer diagram below):
IN+(red wire): Place on right side of the occipital lobe (back of head).IN–(black wire): Place on left side of the occipital lobe.REF(yellow/white wire): Place behind the ear (as above).
Make sure the sticky side of electrodes touches your skin firmly.
EEG Placement#
Using BioAmp Band: For BioAmp Band, refer to the following documentation: Using BioAmp Bands
Step 5: How to upload the Code to Arduino#
Open the folder you downloaded: Brain-BioAmp-Arduino-Firmware
Inside that, you’ll find several subfolders.
Pick the folder for the experiment you want to try. (For beginners: start with the first one and move step-by-step through the others for a better learning experience )
Inside that folder, open the .ino file using Arduino IDE
For example:
To try raw signal: open
01-fixed-sampling.inoTo try filtered signal: open
02-eeg-filter.ino
Note
You’ll find all the experiments listed below, each with step-by-step instructions. Just scroll to the one you’re working on to get started with the right setup.
Connect Your Arduino
Plug your Arduino board into your computer’s USB port using the USB cable.
Wait for the operating system to install any required USB drivers.
In Arduino IDE:
Go to Tools > Board > Arduino UNO choose the model of your board (e.g., “Arduino UNO R4”)
Go to Tools > Port > [select the correct COM port]
Verify (Compile) the Sketch
Click the “✔️ Verify” button (or press
Ctrl + R).Wait for “Done compiling.” If errors appear, double-check you opened the correct .ino file.
Click the ✓ Upload (or press
Ctrl + U) button to send the code to your Arduino.The IDE will compile again and then send the code to your board.
The onboard LED labeled “L” may blink during upload. When you see “Done uploading”, the new firmware is running.
Open Serial Monitor and Serial Plotter (Optional)
For serial monitor and plotter, we recommend using Chords Web. However, if you’re learning to develop, you might also find these options useful.
For Serial Monitor: In the IDE, click Tools → Serial Monitor (or press
Ctrl + Shift + M).Ensure the baud rate at the bottom right of the Serial Monitor is set to
115200(or whatever the sketch’s Serial.begin(115200); line specifies).You should start seeing lines of numbers. Those are your readings.
For Serial Plotter: In the IDE, click Tools → Serial Plotter.
You should start seeing plotting of graph and visualize the waves.
Important
Remember to close the Serial Monitor & Serial Plotter in Arduino IDE before starting the Chords Visualizer.
Step 6: Visualize Your Brain Signals!#
Open this website: https://chords.upsidedownlabs.tech
Click: Visualize Now → then choose Serial Wizard.
Select the correct COM port (same one from Arduino IDE).
Click Connect.
Important
Remember to close the Serial Monitor in Arduino IDE before starting the Chords Visualizer.
Always disconnect your laptop charger while testing. Why? Charging can introduce 50 Hz noise that affects the signal.
🎉 Now sit still and let your mind wander—or blink and shift your gaze—you’ll see real‑time EEG waves on the screen!
Let’s explore all the experiments step by step#
1. Fixed Sampling
1. Program Purpose & Overview
The Fixed Sampling sketch acquires raw EEG/biopotential data from the Brain‑BioAmp’s ADC at a user‑defined, constant rate. By using a hardware timer interrupt rather than a delay loop, it guarantees uniformly‑spaced samples—critical for accurate digital filtering, spectral analysis, or machine‑learning pipelines downstream.
2. How It Works
Initialize the Sensor Pin
The sketch sets an Arduino analog input pin (e.g., A0) to read voltage values from the BioAmp sensor.
Set Sampling Rate
A timer (using
micros()ordelayMicroseconds()) ensures that we callanalogRead(A0)at a precise interval.
Print Raw Values
The user sees raw voltage fluctuations corresponding to brain waves.
Loop Forever
The
loop()continues indefinitely, constantly reading and printing.
3. Perform the Hardware
Refer to wiring as per instructions given in Connect Your Hardware
4. Firmware Upload
For this project, navigate to the repository folder (Brain-BioAmp-Arduino-Firmware/01-fixed-sampling) and select
01-fixed-sampling.ino.To upload firmware, refer to How to upload the Code to Arduino
5. Visualize your signal
Follow the steps given in Visualize Your Brain Signals!
6. Running & Observing Results
Quiet Baseline (No Signal): Trace hovers near mid‑rail.
EEG Burst (e.g. Alpha Waves): You observe rhythmic oscillations.
Muscle Artifact or Motion: Large, slow deflections riding on the baseline.
2. EEG Filter
1. Program Purpose & Overview
The EEG Filter sketch acquires raw EEG data from the BioAmp EXG Pill sensor at 256 Hz and applies a 0.5 – 29.5 Hz 4th‑order Butterworth band‑pass filter (implemented as four biquad sections) to isolate true EEG rhythms. By stripping out slow DC drifts and high‑frequency noise, you obtain a clean EEG stream ideal for real‑time visualization, event detection, or further spectral analysis.
2. How It Works
Initialize the Sensor Pin
The sketch configures an Arduino analog input pin (e.g., A0) to read voltage values from the BioAmp sensor.
Compute Elapsed time
A static
pasttimestamp holds the previous sample’s microsecond count.present = micros()andinterval = present – pastgive the time since the last loop.pastis updated to present for the next iteration.
Run the Sample Timer
A static
timervariable counts down byintervaleach loop.When
timer < 0, it’s time to take the next sample:
timer += 1000000 / SAMPLE_RATE; // ≈3906 µs for 256 Hz
Acquire Raw Sample
Calls
analogRead(INPUT_PIN)(e.g.A0) to get the latest ADC count from the BioAmp output.Converts the integer reading to a
float sensor_value.
Apply 4th‑Order Butterworth Band‑Pass.
Passes
sensor_valueintoEEGFilter(input), which implements four cascaded biquad sections.Coefficients (
a1, a2, b0, b1, b2) were generated via SciPy’sbutter()and exported byfilter_gen.py.Each section maintains two static states (
z1,z2), computes the difference‑equation:
x = output – a1*z1 – a2*z2;
output = b0*x + b1*z1 + b2*z2;
z2 = z1;
z1 = x;
Stream Filtered Output
After filtering, Serial.println(signal); sends the clean EEG value to your PC or host.
Loop Forever
The sketch never blocks: timing logic and filtering run every ≈3.9 ms (256 Hz), then immediately repeat.
To learn more about filters and how to generate new filters, visit: https://docs.scipy.org/doc/scipy/reference/generated/scipy.signal.butter.html
3. Perform the Hardware
Refer to wiring as per instructions given in Connect Your Hardware
4. Firmware Upload
For this project, go to the repository folder (Brain-BioAmp-Arduino-Firmware/02-eeg-filter) and select
02-eeg-filter.ino.To upload firmware, refer to How to upload the Code to Arduino
5. Visualize your signal
Follow the steps given in Visualize Your Brain Signals!
You’ll see a smooth EEG waveform updating at 256 Hz, free of drift and high‑frequency spikes.
6. Running & Observing Results
Quiet Rest (Eyes Closed): Trace should be mostly low‑amplitude noise around zero.
Alpha Rhythm (8–12 Hz): Rhythmic oscillations become clearly visible after you close your eyes and relax.
Movement Artifacts (>30 Hz): Spikes from blinks or muscle tension are greatly attenuated, keeping the focus on EEG bands.
3. BCI FFT
This foundational sketch is designed to display real-time EEG bandpower values—Delta, Theta, Alpha, Beta, and Gamma—on the Arduino IDE’s Serial Monitor. It serves as a powerful tool for observing how your brain state affects brainwave activity. For instance, you’ll notice a rise in beta waves when focusing on a single point, and an increase in alpha waves when you close your eyes and relax. It’s ideal for understanding how different activities in the brain influence your EEG signals.
For this project, you need to do electrode placement as per the given figure:
For detailed guide, visit our Instructables Page: Controlling LEDs of Arduino Uno R4 With Your Mind (EEG)
For a detailed walkthrough, follow along with the YouTube tutorial for this project:
Note
This project will only work with Arduino UNO R4 Minima and R4 WiFi board.
4. BCI LED
This sketch allows you to control the built-in LED on the Arduino UNO R4 using your focus. When your beta activity rises (indicating strong concentration), the LED lights up. As your mind relaxes and beta power drops, the LED turns off. It creates a simple yet effective neurofeedback to train and observe your concentration levels.
For this project, you need to do electrode placement as per the given figure:
Placement between F1 and F2#
For detailed guide, visit our Instructables Page: Controlling LEDs of Arduino Uno R4 With Your Mind (EEG)
For a detailed walkthrough, follow along with the YouTube tutorial for this project:
Note
This project will only work with Arduino UNO R4 Minima and R4 WiFi board.
5. BCI Toggle
The BCI Toggle program enables hands-free toggling of the built-in LED using sustained focus. By maintaining your concentration for 4–5 seconds, the system switches the LED on or off, like flipping a switch using your brain. This method can be extended to control other devices, making it a stepping stone for brain-controlled automation.
For this project, you need to do electrode placement as per the given figure:
Electrode Placement between F1 and F2#
For detailed guide, visit our Instructables Page: Controlling LEDs of Arduino Uno R4 With Your Mind (EEG)
For a detailed walkthrough, follow along with the YouTube tutorial for this project:
Note
This project will only work with Arduino UNO R4 Minima and R4 WiFi board.
6. BCI Spiral
The BCI Spiral program is one of the most engaging and interesting sketch as it transforms your focus into gameplay.
Running on the Arduino UNO R4 WiFi, it controls the 12×8 LED matrix on the board. As you concentrate, LEDs begin to light up in a clockwise spiral pattern.
The more intense and sustained your focus, the more the spiral progresses. If your concentration lapses, the spiral unwinds in reverse. This sketch creates an immersive and intuitive brain-training game driven entirely by your EEG signals.
For this project, you need to do electrode placement as per the given figure:
For detailed guide, visit our Instructables Page: Controlling LEDs of Arduino Uno R4 With Your Mind (EEG)
For a detailed walkthrough, follow along with the YouTube tutorial for this project:
Note
This project will only work with Arduino UNO R4 WiFi board.
✅ And That’s it!, Congrats on making your neuroscience project using BioAmp Hardware.