Heart (ECG) BioAmp Arduino Firmware#
What is Electrocardiography (ECG)?#
Electrocardiography [1] is the process of producing an electrocardiogram (ECG or EKG), a recording of the heart’s electrical activity through repeated cardiac cycles. It is an electrogram of the heart which is a graph of voltage versus time of the electrical activity of the heart using electrodes placed on the skin. These electrodes detect the small electrical changes that are a consequence of cardiac muscle depolarization followed by repolarization during each cardiac cycle (heartbeat).
To know more about ECG visit here.
Who is this for?#
Anyone who’s using the BioAmp Hardware for the very first time — whether you’re a student, hobbyist, educator or just curious. No experience needed!
👉 To learn about our BioAmp Hardware checkout the hardware page.
Step-by-Step Setup Guide#
With the hardware in your hands, you’re just a few steps away from unlocking its full potential — let’s get the software set up!
Step 1: Downloading GitHub Repository for Hardware#
This is the code your Arduino needs to read Heart (ECG) signals.
You have two easy ways to get the code that will help you read your ECG signals:
Simply Download (recommended for beginners)
Go to the GitHub page: Heart BioAmp Arduino Firmware
Click the green “Code” button > Download ZIP
Unzip the folder and save it somewhere easy to find.
Clone using Git (for tech-savvy users)
Install Git for your OS: https://git-scm.com/
Clone this GitHub repository using
git clone https://github.com/upsidedownlabs/Heart-BioAmp-Arduino-Firmware
Step 2: Application Required#
Before you start using the kit, please download or open the following:
Arduino IDE
We need Arduino IDE to upload code to your Arduino board
Link to download IDE for your OS: https://www.arduino.cc/en/software
Chords Website
We will use Chords Website to visualize the Heart Signals!
Open this website: Chords Web
Step 3: Connect Your Hardware#
Plug the Hardware into your Arduino UNO using jumper wires.
Follow the exact wiring diagram from the hardware documentation of the hardware you are using.
Hardwares that are compatible with Heart BioAmp Firmware:
It’s just like putting together a puzzle!
Step 4: Skin Preparation and Electrodes Placement#
Using Gel Electrodes:
Prepare your skin
Choose the area where you’ll place the electrodes.
Wipe the chest area using an alcohol swab or Nuprep Gel to remove oils and dead cells — this improves signal clarity.
Note
Need help with skin prep? Check out the full guide here: Skin Preparation Guide
Attach the wires to the electrodes, then attach the electrodes to skin (refer diagram below):
IN+(positive): Left side of chest, closer to the heartIN–(negative): Left side of the chest , just under the collarbone, near to positive electrode.REF(reference): Right side of chest, far from the heart (over the ribs)
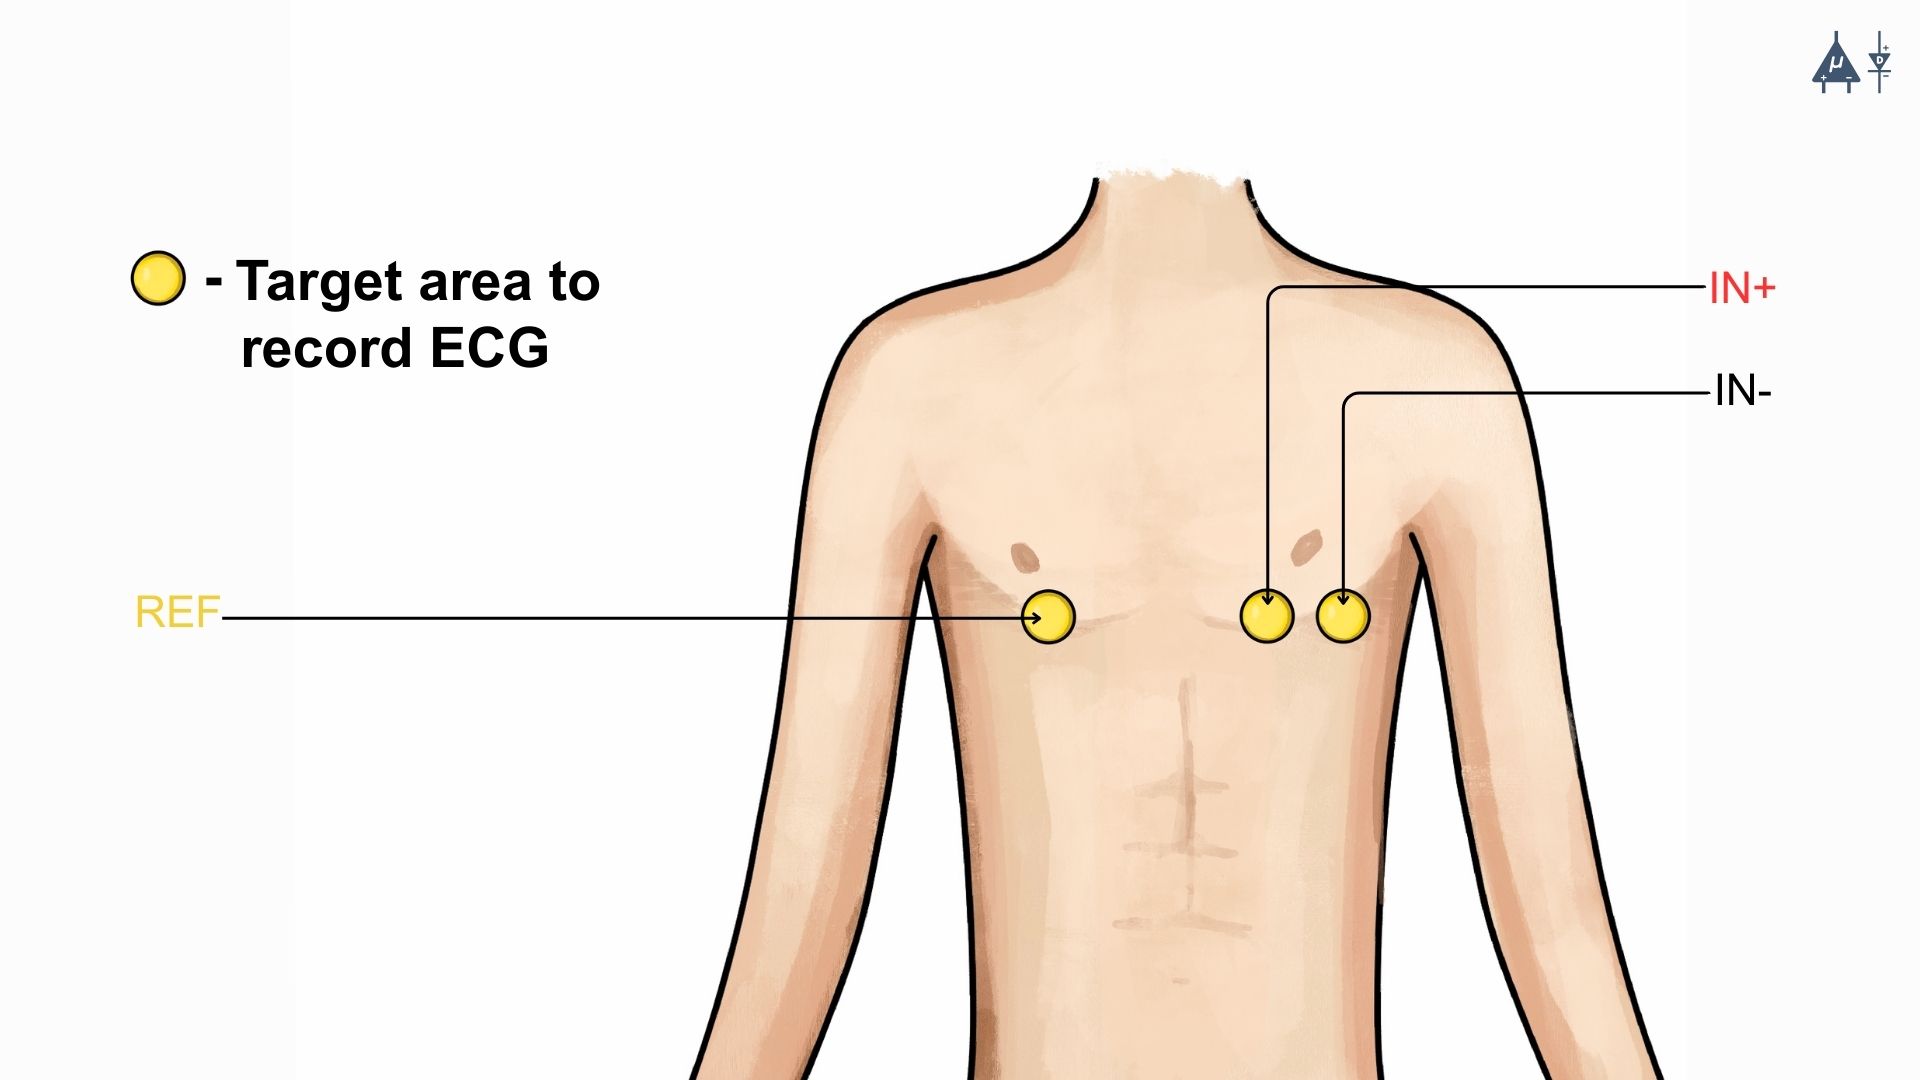
ECG Placement#
Using BioAmp Band: For BioAmp Band, refer to the following documentation: Using BioAmp Bands
Step 5: How to upload the Code to Arduino#
Open the folder you downloaded: Heart-BioAmp-Arduino-Firmware
Inside that, you’ll find several subfolders.
Pick the folder for the experiment you want to try. (For beginners: start with the first one and move step-by-step through the others for a better learning experience)
Inside that folder, open the .ino file using Arduino IDE
For example:
To try raw signal: open
1_FixedSampling.inoTo try filtered signal: open
2_ECGFilter.ino
Note
You’ll find all the experiments listed below, each with step-by-step instructions. Just scroll to the one you’re working on to get started with the right setup.
Connect Your Arduino
Plug your Arduino board into your computer’s USB port using the USB cable.
Wait for the operating system to install any required USB drivers.
In Arduino IDE:
Go to Tools > Board > Arduino UNO choose the model of your board (e.g., “Arduino Uno” or “Arduino Nano” if you wired to a Nano)
Go to Tools > Port > [select the correct COM port]
Verify (Compile) the Sketch
Click the “✔️ Verify” button (or press
Ctrl + R).Wait for “Done compiling.” If errors appear, double-check you opened the correct .ino file.
Click the ✓ Upload (or press
Ctrl + U) button to send the code to your Arduino.The IDE will compile again and then send the code to your board.
The onboard LED labeled “L” may blink during upload. When you see “Done uploading”, the new firmware is running.
Open Serial Monitor and Serial Plotter (Optional)
For serial monitor and plotter, we recommend using Chords Web. However, if you’re learning to develop, you might also find these options useful.
For Serial Monitor: In the IDE, click Tools → Serial Monitor (or press
Ctrl + Shift + M).Ensure the baud rate at the bottom right of the Serial Monitor is set to
115200(or whatever the sketch’s Serial.begin(115200); line specifies).You should start seeing lines of numbers. Those are your readings.
For Serial Plotter: In the IDE, click Tools → Serial Plotter.
You should start seeing plotting of graph and visualize the waves.
Important
Remember to close the Serial Monitor & Serial Plotter in Arduino IDE before starting the Chords Visualizer.
Step 6: Visualize Your Heart Signals!#
Open this website: Chords Web
Click: Visualize Now → then choose Serial Wizard.
Select the correct COM port (same one from Arduino IDE).
Click Connect.
Important
Always disconnect your laptop charger while testing. Why? Charging can introduce 50 Hz noise that affects the signal.
🎉 Now sit back, relax, and stay still—or take a deep breath—you’ll see your heartbeat come alive as real‑time ECG waves dancing across the screen!
Let’s explore all the experiments step by step#
1. Fixed Sampling
1. Program Purpose & Overview
The Fixed Sampling program reads the raw electrical signal of your heart (ECG) using an analog pin and prints it to the Serial Monitor. It’s useful for understanding what the unfiltered heart signal looks like. Think of it like looking at the “raw ingredients” before cooking.
2. How It Works
analogRead(A0)reads voltage from the Heart BioAmp sensor.Serial.println()prints those values to the computer.A timer ensures values are read at a steady rate.
You can see how heart beats changes the waveform.
3. Perform the Hardware
Refer to wiring as per instructions given in Connect Your Hardware
4. Firmware Upload
For this project, navigate to the repository folder (Heart-BioAmp-Arduino-Firmware/1_FixedSampling) and select
1_FixedSampling.ino.To upload firmware, refer to How to upload the Code to Arduino
5. Visualize your signal
Follow the steps given in Visualize Your Heart Signals!
6. Running & Observing Results
The numbers jump up and down rapidly, reflecting every tiny fluctuation in the raw ECG voltage.
Baseline wander (slow drift up/down over seconds).
High‑frequency spikes (muscle noise, line interference).
The peaks corresponding to heartbeats are buried in noise and drift—this is purely your unfiltered signal.
2. ECG Filter
1. Program Purpose & Overview
The ECG Filter program passes your raw ECG through a digital band‑pass filter (0.5–44.5 Hz), removing baseline drift and high‑frequency noise so you see only the heart’s true waveform.
Real ECGs have very slow wandering trends (e.g. breathing‑related drift) and high‑frequency interference (muscle noise, powerline hum). A band‑pass filter isolates the clinically relevant 0.5–44 Hz band where the QRS complex and T‑waves live.
2. How It Works
Uses a bandpass IIR filter order and coefficients chosen to sharply cut below 0.5 Hz and above 44.5 Hz.
Applies filter sample‑by‑sample inside the same fixed‑rate loop.
Prints filtered values to Serial Monitor.
To learn more about filters and how to generate new filters, visit: https://docs.scipy.org/doc/scipy/reference/generated/scipy.signal.butter.html
3. Perform the Hardware
Refer to wiring as per instructions given in Connect Your Hardware
4. Firmware Upload
For this project, go to the repository folder (Heart-BioAmp-Arduino-Firmware/2_ECGFilter) and select
2_ECGFilter.ino.To upload firmware, refer to How to upload the Code to Arduino
5. Visualize your signal
Follow the steps given in Visualize Your Heart Signals!
6. Running & Observing Results
A smooth, centered waveform where the QRS complexes (the heart’s main spikes) and T‑waves stand out clearly.
You should easily spot the repeating pattern of one large spike (R‑peak) followed by smaller waves (P and T waves).
If you flex or cough gently, you may see transient artifacts—these will be suppressed compared to the unfiltered signal.
For detailed guide, visit our Instructables Page: Record Publication Grade ECG at Your Home Using BioAmp EXG Pill
3. Heart Rate Detection
The Heart Rate Detection transforms your filtered ECG signal into a live, numerical heart‑rate readout. As the Arduino continuously samples the cleaned‑up ECG waveform from the BioAmp EXG Pill, this sketch identifies each heartbeat’s characteristic R‑wave peak and timestamps its occurrence. By measuring the time between successive peaks, it calculates your beats per minute (BPM) and prints the result to the Serial Monitor, giving you a real‑time view of your current heart rate without any external software or display.
Under the hood, the sketch operates like a simple digital stethoscope: it maintains a running scan of the incoming ECG, and whenever the signal sharply rises above a chosen threshold—indicating an R‑wave—it marks that as one beat. It then computes the interval since the previous beat and applies the standard conversion (60 000 ms divided by the interval) to determine BPM. This approach delivers an immediate and intuitive heart‑rate measurement, turning raw biopotential spikes into meaningful, human‑readable data.
For detailed guide, visit our Instructables Page: Measuring Heart Rate Using BioAmp EXG Pill
4. Heart Beat Detection
The Heart Beat Detection program converts your filtered ECG waveform into a reliable count of heartbeats by monitoring the signal’s “energy” rather than raw peaks. As the Arduino continuously reads the cleaned ECG from the BioAmp EXG Pill, this sketch computes a short‑term measure of signal variability—essentially a running envelope or standard deviation of the voltage. Whenever that envelope surges above a tuned threshold (indicating the rapid voltage change of an R‑wave), the code registers a single heartbeat and then waits for the signal to subside below the threshold again, ensuring each beat is counted only once.
By tracking the moments when the envelope crosses its threshold, the sketch builds a real‑time tally of your heartbeats. Rather than simply looking for voltage spikes, it uses the envelope to smooth out noise and baseline drift, making it far more robust in everyday, less‑controlled settings. The result is a dependable heartbeat counter that works even if the ECG amplitude varies or your electrodes shift slightly—perfect for basic heart‑rate monitoring without complex peak‑detection circuitry.
For detailed guide, visit our Instructables Page: Detecting Heart Beats Using BioAmp EXG Pill
Checkout Demo Visualization on YouTube:
5. BLE Heart Rate Detection
To be documented.
6. Faster Heart Rate Detection
1. Program Purpose & Overview
The Faster Heart Rate Detection sketch delivers the same beat‑to‑BPM functionality as its predecessor but in a highly optimized package. It reads your ECG from the BioAmp EXG Pill and Muscle BioAmp Shield at a controlled 125 Hz rate, applies a four‑stage Butterworth band‑pass IIR filter to isolate the 0.5–44.5 Hz heartband, then detects each R‑wave using a running‑buffer envelope method. Rather than simple threshold‑crossing, it uses a small circular window of recent samples to compute both the mean and standard deviation, flagging a heartbeat only when the incoming sample exceeds the current mean by more than half the window’s standard deviation and respects a brief debounce interval.
2. How It Works
Fixed‐rate sampling at 125 Hz using a microsecond timer (micros() + timer loop) ensures consistent data intervals with very little timing overhead.
Inlined 4‑section Butterworth IIR filter (ECGFilter()) removes baseline drift and high‑frequency noise in a single pass, avoiding function‑call costs.
Envelope‑based peak detection over a 26‑sample circular buffer computes mean and standard deviation on the fly, flagging a heartbeat only when the current sample exceeds mean + 0.5 × stddev.
Debounce logic (peakCooldownPeriod = 2 ms) uses just two Booleans and a timestamp to prevent false re‑triggers on the same beat.
Circular timing buffers (timeBuffer/sumBuffer, size 5) average recent inter‑beat intervals before converting to BPM, smoothing out irregularities without large loops.
3. Perform the Hardware
Refer to wiring as per instructions given in Connect Your Hardware
4. Firmware Upload
For this project, go to the repository folder (Heart-BioAmp-Arduino-Firmware/6_Faster_HeartRateDetection) and select
6_Faster_HeartRateDetection.ino.To upload firmware, refer to How to upload the Code to Arduino
5. Visualize your signal
Follow the steps given in Visualize Your Heart Signals!
6. Running & Observing Results
Smooth Readings: Thanks to the small moving‐average buffer, your displayed BPM stays steady, even if a beat comes slightly early or late.
Low CPU Usage: The loop remains fast and responsive, so you can add displays or wireless features without missing any heartbeats.
7. OLED BPM
The OLED BPM program turns your Arduino‑measured heart rate into a real‑time, on‑screen display. As your BioAmp sensor and beat‑detection code calculate BPM, this sketch:
Renders large, easy‑to‑read numerals on a 128×64 OLED so you can see your current heart rate at a glance.
Updates the display instantly each time a new heartbeat is detected, keeping the shown BPM in sync with your pulse.
Optionally animates a pulsing icon or simple bar alongside the number, giving a visual “heartbeat” cue.
In other words, OLED BPM makes your Arduino setup function as a standalone heart‑rate monitor—no PC, phone, or external plotting required.
For detailed guide, visit our Instructables Page: Heartrate on OLED Display in Real Time
✅ And That’s it!, Congrats on making your neuroscience project using BioAmp Hardware.