
Module 8: ECG/EKG#
Basic Terminology#
Electrocardiography(ECG): Electrocardiography is a non-invasive technique used to record the electrical activity generated by the heart during each cardiac cycle. It is obtained by placing electrodes on the surface of the body, which detect electrical signals produced by the depolarization and repolarization of cardiac muscle cells.
Electrocardiograph: An electrocardiograph is the electronic device used to record the electrical activity of the heart. It detects electrical signals from electrodes placed on the skin, amplifies these signals, and converts them into a visible recording that can be displayed on a monitor or printed on ECG paper.
Electrocardiogram: An electrocardiogram is the graphical recording produced by the electrocardiograph that represents the electrical activity of the heart over time.
Note
If you want to know detailed history of ECG, you can refer to this section: History of ECG
8.1 Introduction#
An ECG (also called EKG) is a non-invasive test that records the electrical activity of the heart over a period of time using electrodes placed on the skin. It is the most important tool for evaluating cardiac rhythm, detecting ischemia/infarction, identifying conduction abnormalities, chamber hypertrophy, electrolyte disturbances, drug effects, and many inherited or acquired cardiac conditions.
ECG frequency range : Modern ECG machines record ECG signals in the bandpass from 0.05 (or 0.5) Hz to 100 (or 150) Hz as an industry standard. [1]
8.2 Basic principle#
The ECG records the changes in electrical potential (voltage) on the surface of the body that are generated by the depolarization and repolarization of cardiac muscle cells.
Each heartbeat is controlled by organized electrical signals in the heart. When millions of heart muscle cells depolarize (activate) and repolarize (recover) at nearly the same time, they generate tiny electrical currents. These currents travel through the body and reach the skin. The ECG machine picks up these small voltage differences between different points on the body, amplifies them, and displays them as a waveform over time.
8.3 ECG procedure#
The process of performing an ECG includes the following steps:
Preparation: The patient is typically asked to lie down on an examination table. The skin surface where electrodes will be placed is cleaned to ensure good electrical contact.
Electrode Placement: Electrodes are attached to the patient’s body. For a 12-lead ECG, 10 electrodes are placed (4 on the limbs and 6 on the chest).
Recording: The ECG machine records the electrical activity from each lead, and the resulting waveforms are printed or displayed on a monitor.
Analysis: The physician analyses the recorded ECG waveforms to evaluate the heart’s electrical activity.
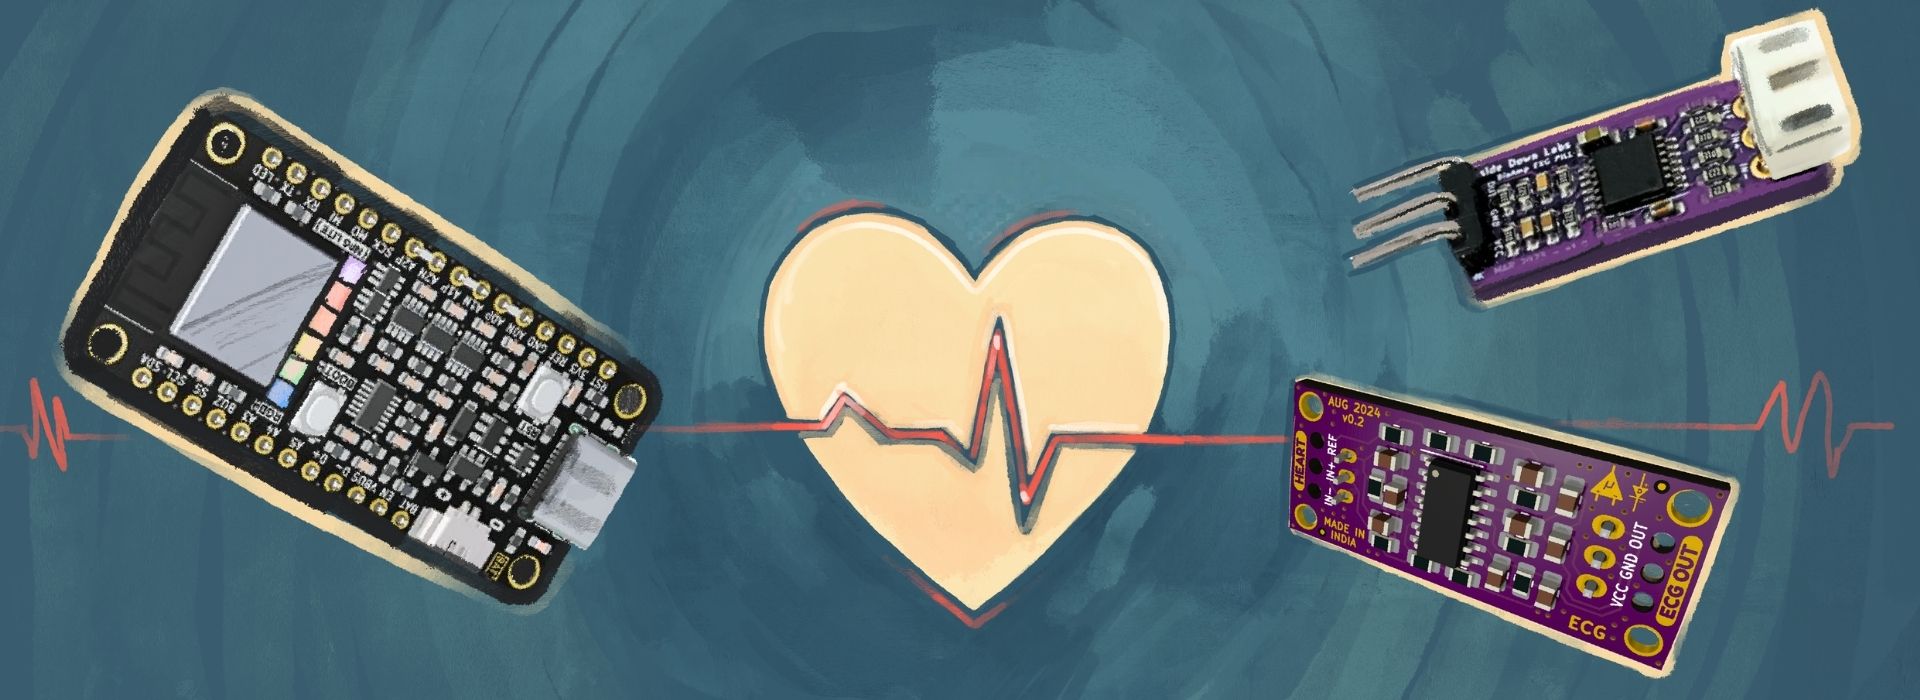
Upside Down Labs Hardware compatible with ECG/EKG signal acquisition and processing:
We offer our own open source Chords software suite, featuring tools for signal visualization, data recording (with easy save and download options), time-based plotting, and a host of other benefits such as analyzing signal frequencies and bandpower.
8.4 Components of the ECG#
An ECG is composed of several waves, intervals, and segments, each corresponding to a specific phase of the heart’s electrical cycle.
Note
Waves : Deflection from baseline on an ECG
Segments : Flat lines between waves
Intervals : Time durations that include both wave and segment
8.4.1 ECG PQRST Waveform [4]#
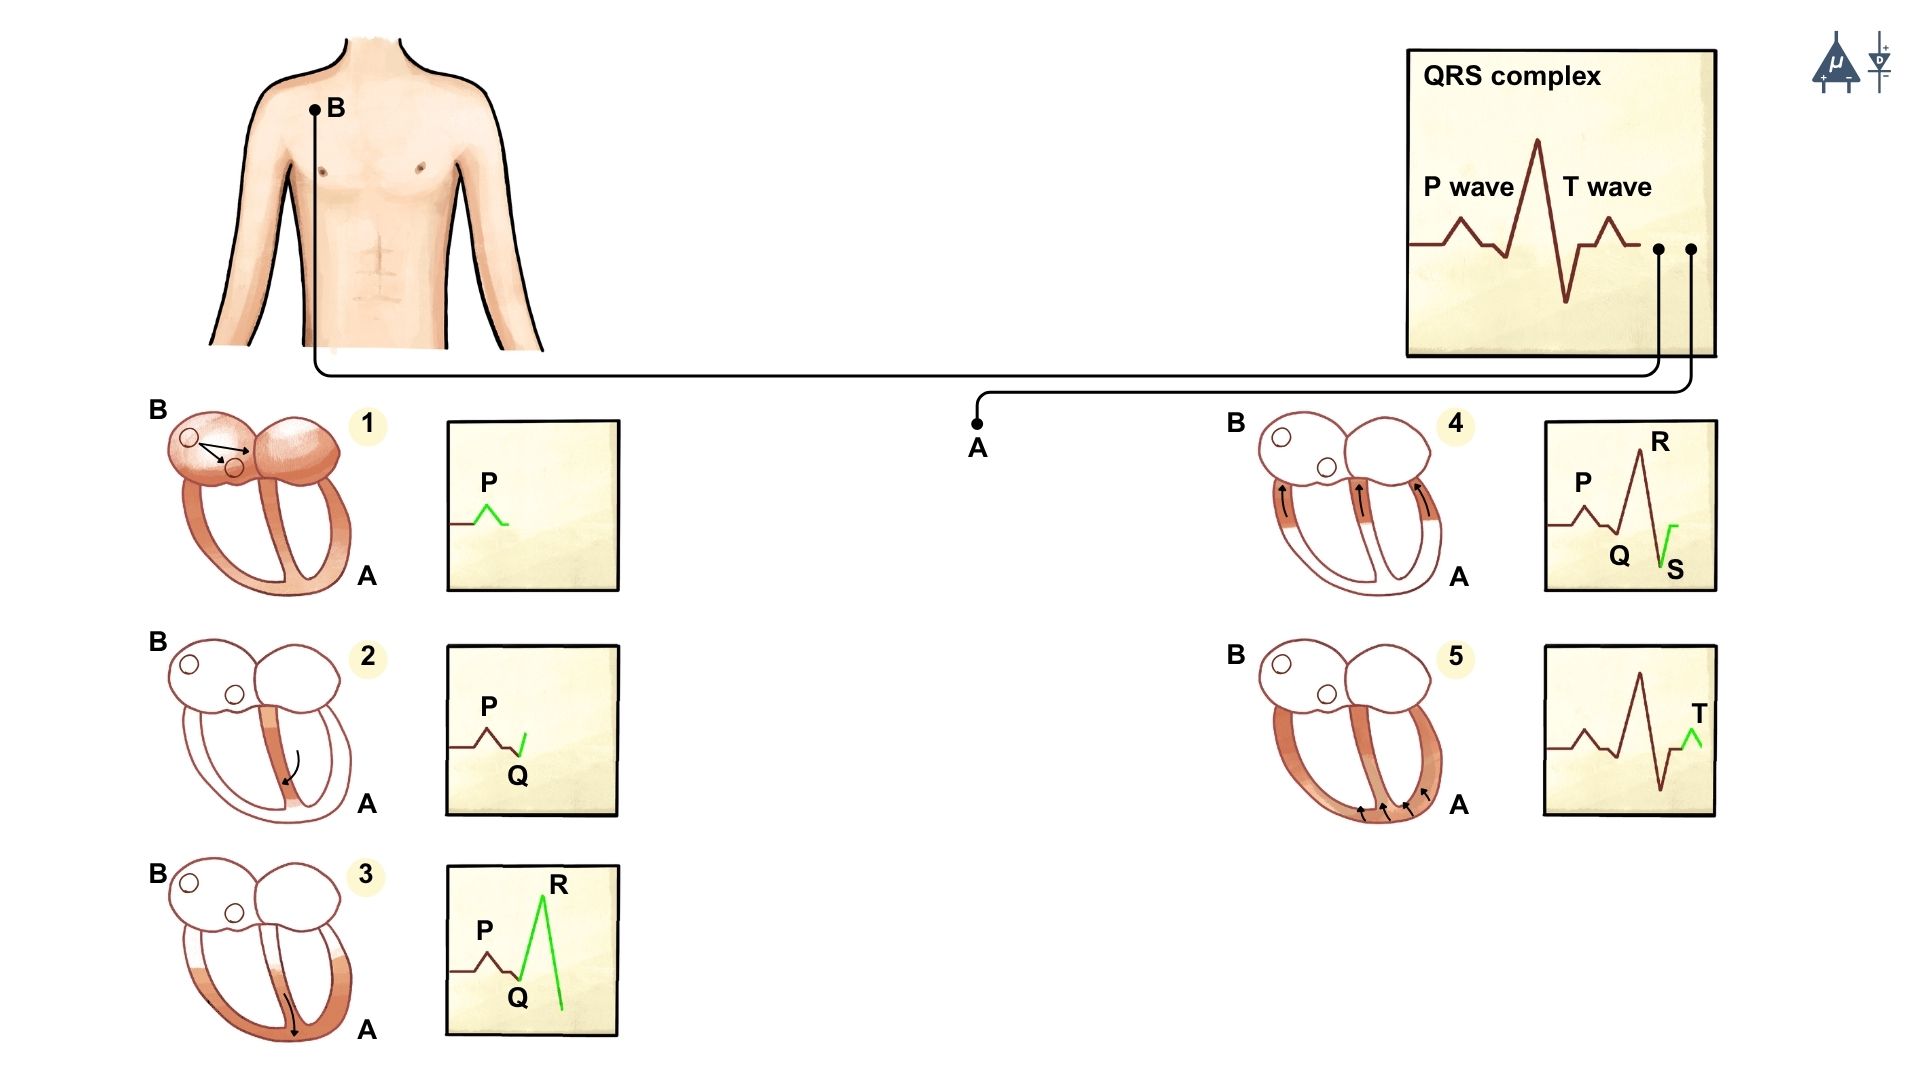
P Wave: Represents atrial depolarization. It is the first small upward deflection on the ECG.
PR Interval: This is the interval between the beginning of the P wave and the beginning of the QRS complex.
Normal duration: The range of PR interval is from 0.12 to 0.20 second (average 0.18 s). PR interval shortens as the heart rate increases from the average of 0.18 s at the rate of 70 to 0.14 s at the rate of 130.
Significance: This represents atrial depolarization and conduction through AV node.
QRS Complex: Represents ventricular depolarization, which triggers ventricular contraction. It consists of:
Q Wave: The first negative deflection after the P wave.
R Wave: The first positive deflection after the Q wave.
S Wave: A negative deflection after the R wave.
QRS Interval: The QRS interval is measured from the beginning of the Q wave (or R wave if the Q is absent) to the end of the S wave, which is the point where the wave returns to the baseline, known as the J point
Normal duration: The normal QRS interval is between 0.06 and 0.10 seconds (60 to 100 milliseconds).
Significance: This represents ventricular depolarization. The atrial repolarization (Ta wave) also occurs during this period.
ST Segment: This is the interval between the J point and ends at the beginning of T wave.
Normal duration: The average duration is 0.08 to 0.12 second (rate dependent).
Significance: This represents ventricular repolarization.
T Wave: Represents ventricular repolarization, or the recovery phase after contraction.
QT Interval: This interval includes the QRS complex, ST segment and T wave. It is measured from the beginning of the QRS complex to the end of the T wave.
Normal duration: The normal range is between 0.40 and 0.43 second.
Significance: This represents ventricular depolarization and ventricular repolarization. It corresponds to the duration of electrical systole.
U Wave: A small deflection sometimes seen after the T wave, its exact cause is not fully understood, but it may reflect repolarization of the Purkinje fibers or the papillary muscles. A prominent U wave indicates hypokalemia (low potassium levels).
P-P Interval: This is the interval measured between either the peak or the beginning of two successive P waves. PP interval is measured for calculation of the atrial rate.
R-R Interval: This is the interval between two successive R waves. It is measured between the peaks of two successive R waves. RR interval is used to calculate the heart rate .
8.4.2 ECG Leads and Placement#
Note
In an electrocardiogram (ECG), a lead refers to a specific electrical connection between two electrodes on the body, which allows the recording of the heart’s electrical activity from a particular angle or perspective, essentially providing a “view” of the heart’s electrical signals from different directions. A standard 12-lead ECG uses 10 electrodes to create 12 different leads, giving a comprehensive picture of the heart’s electrical activity.
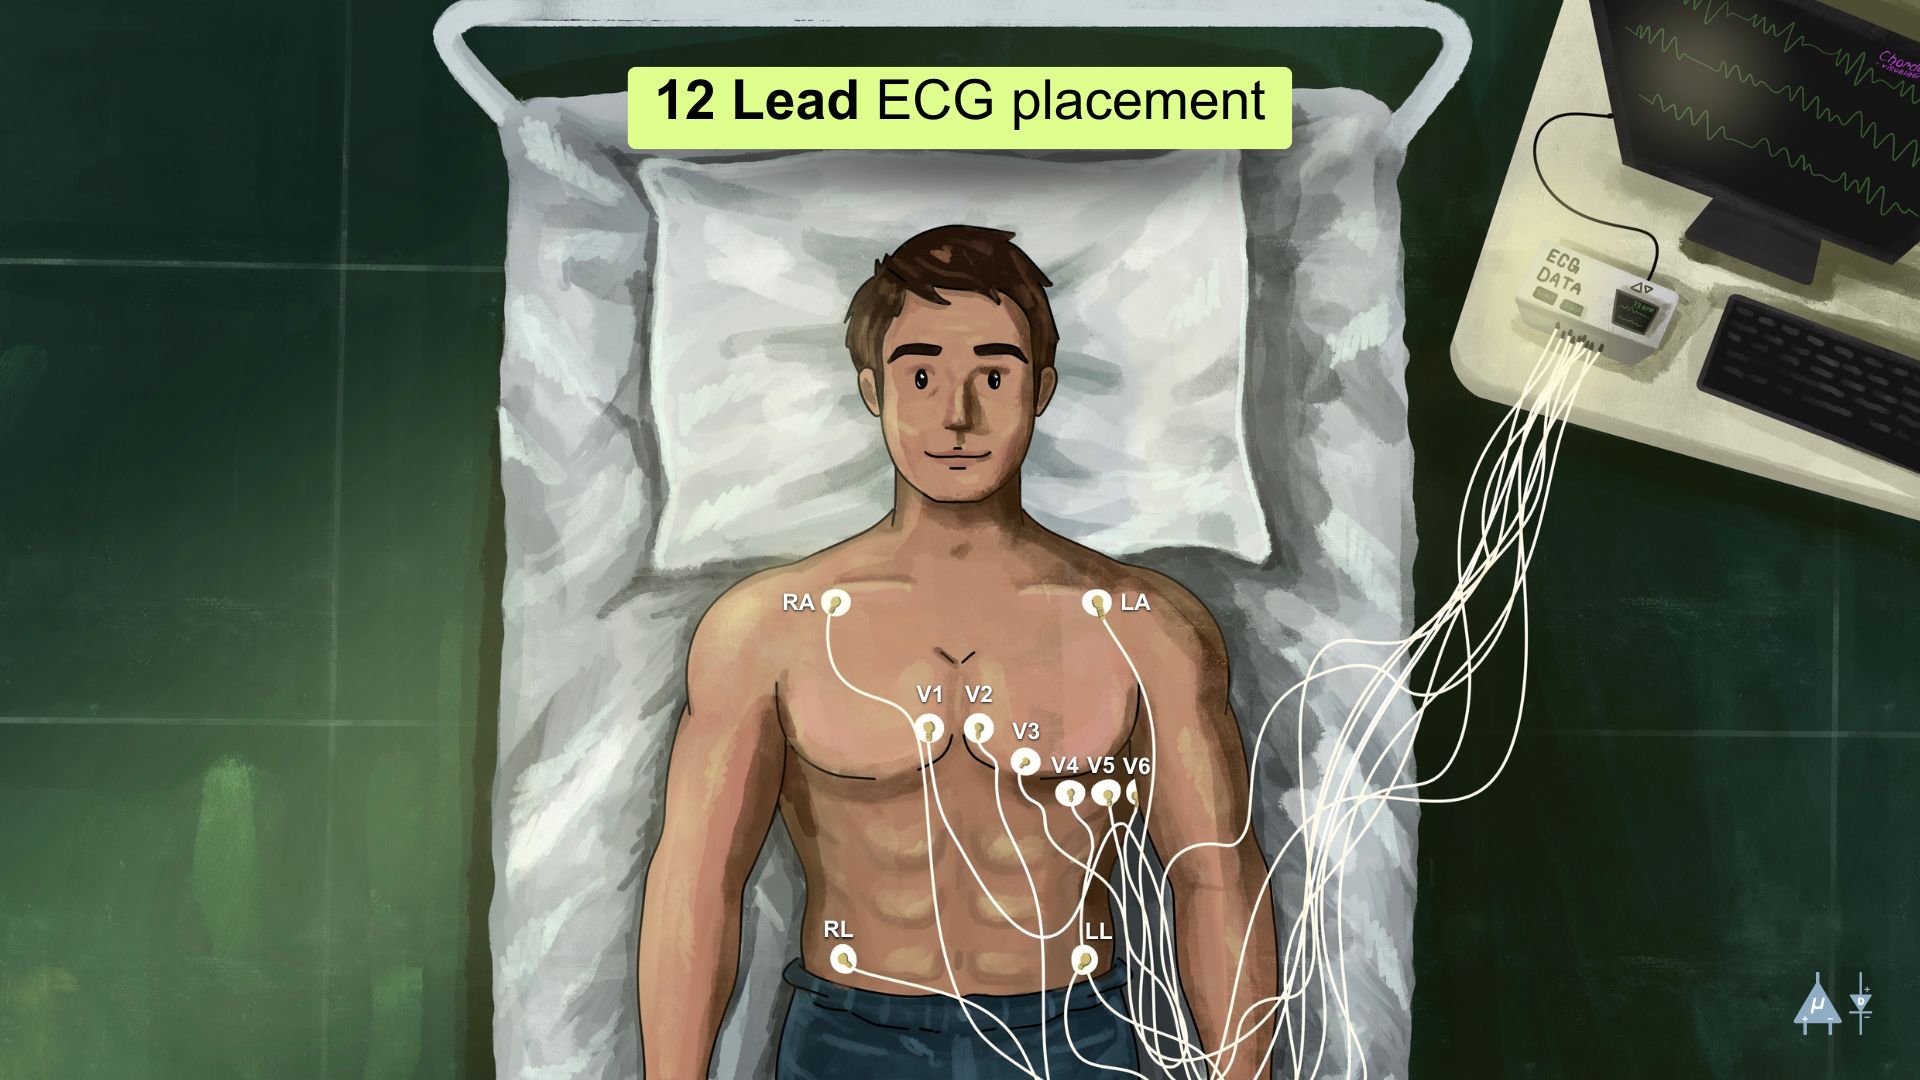
12-lead ECG Electrode Placement#
Bipolar Leads (I, II, III): These leads record the electrical activity between two points.
Lead I: Measures between the right and left arm.
Lead II: Measures between the right arm and left leg.
Lead III: Measures between the left arm and left leg.
Augmented Unipolar Leads (aVR, aVL, aVF): These leads use a central reference point and measure the electrical potential difference between one electrode and the average of the other two electrodes.
aVR: Measures the electrical activity from the right shoulder.
aVL: Measures the electrical activity from the left shoulder.
aVF: Measures the electrical activity from the left leg.
Precordial/Chest Leads (V1 to V6): These are placed directly on the chest and provide a more localized view of the heart’s electrical activity.
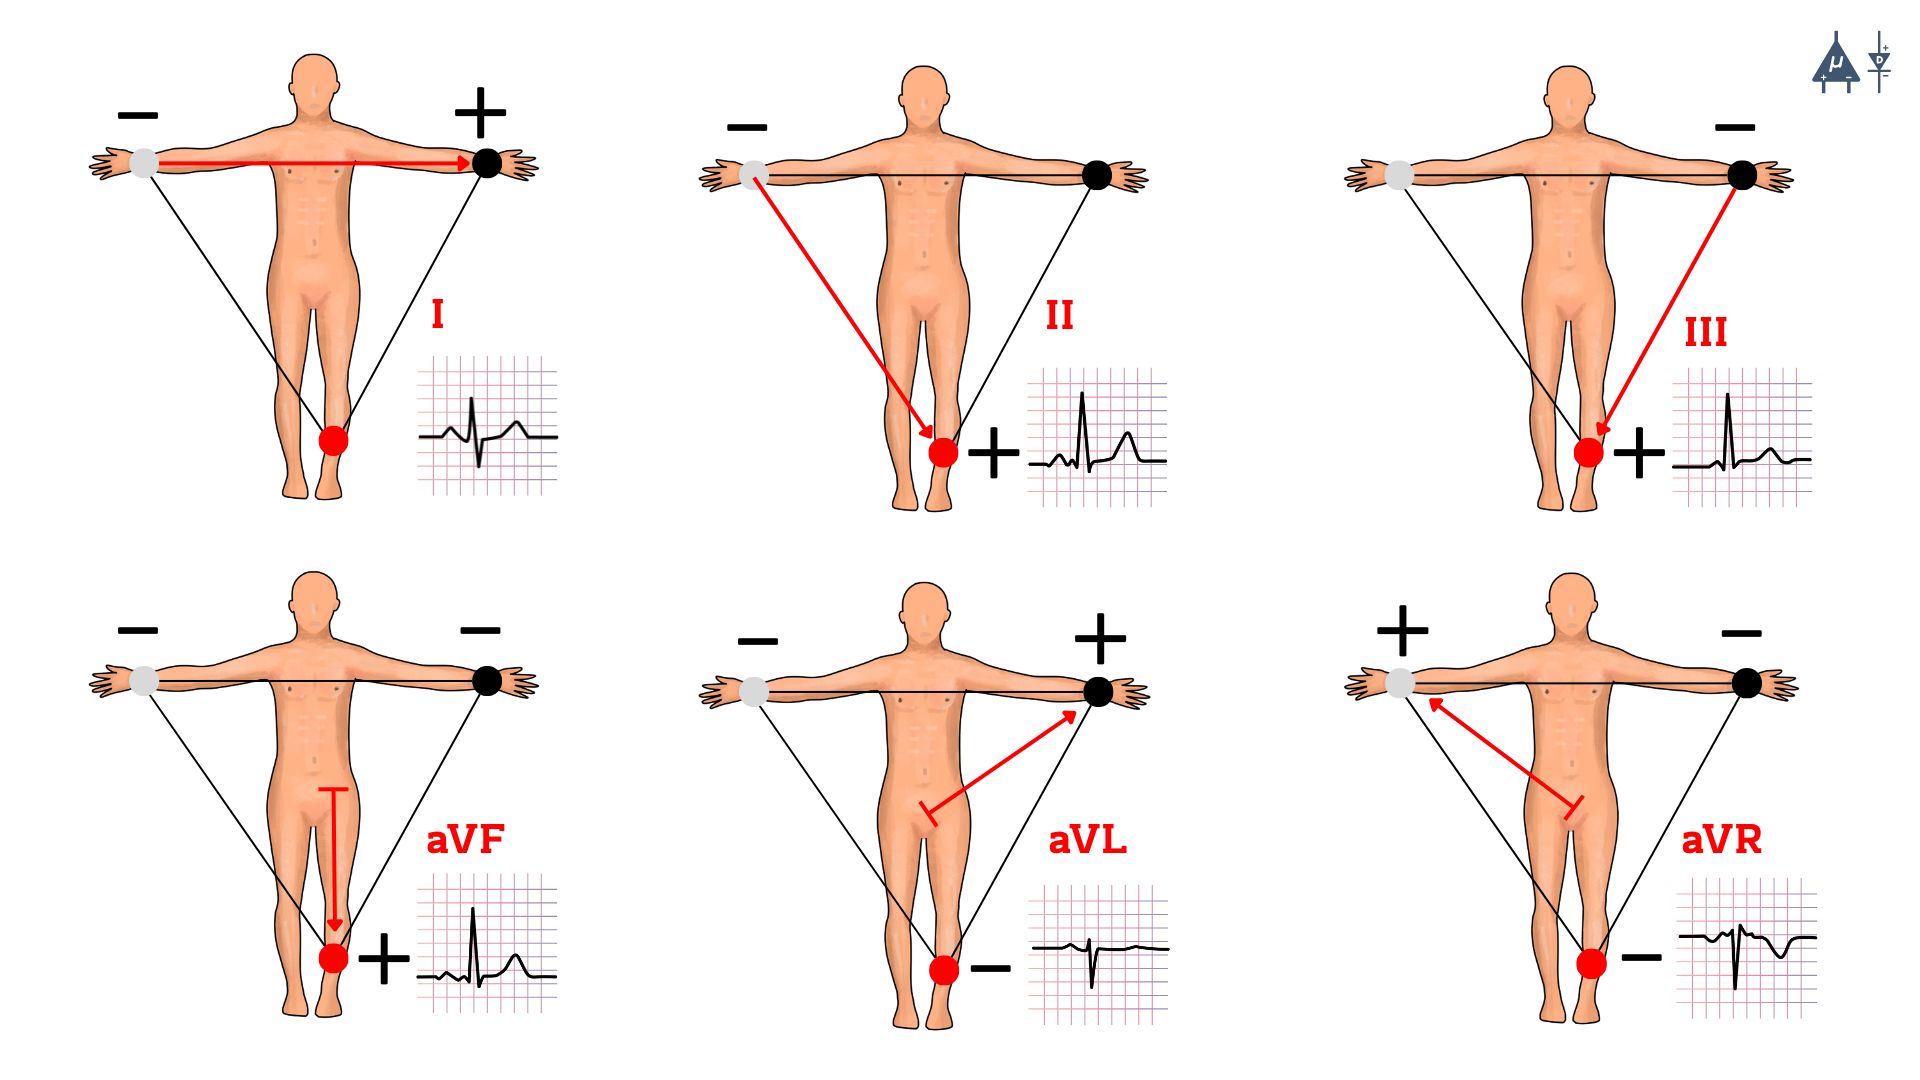
Hexaxial Reference System for Limb Leads#
8.4.3 Cardiac Axis [5]#
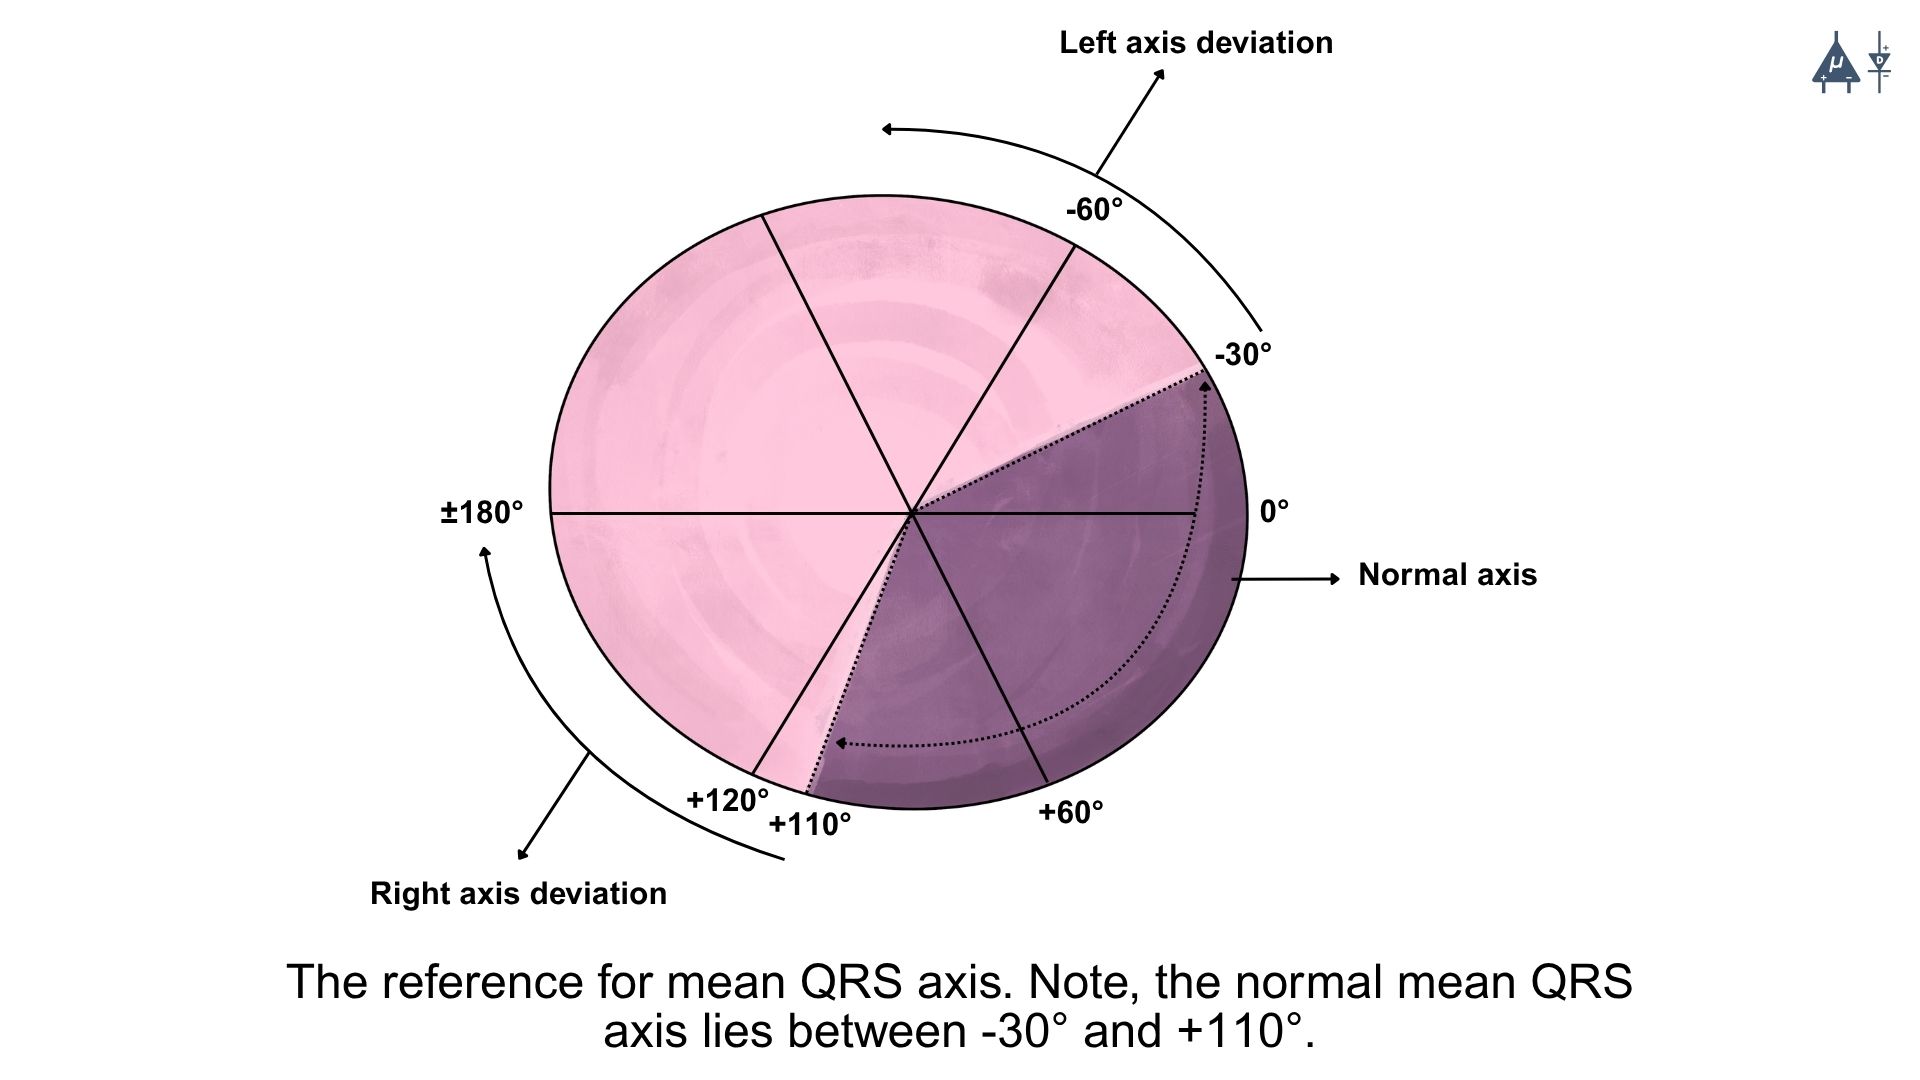
The cardiac axis refers to the overall direction of electrical depolarization of the ventricles during the QRS complex. It represents the average direction in which the electrical impulse spreads through the ventricles. The cardiac axis is usually expressed in degrees and is analyzed using the frontal plane limb leads of the ECG. In a healthy adult, the normal cardiac axis ranges from –30° to +90°.
How to Calculate the Cardiac Axis (Simple Method)?#
The cardiac axis is commonly determined using ECG limb leads, especially Lead I and Lead aVF.
Step 1: Observe Lead I
If the QRS complex is positive (upright) → electrical activity is moving toward the left side. If negative → axis is deviated to the right
Step 2: Observe Lead aVF
If the QRS complex is positive → axis is directed downward. If negative → axis is directed upward.
Step 3: Determine Axis Position
Lead I |
Lead aVF |
Axis Type |
|---|---|---|
Positive |
Positive |
Normal Axis |
Positive |
Negative |
Left Axis Deviation |
Negative |
Positive |
Right Axis Deviation |
Negative |
Negative |
Extreme Axis Deviation |
Clinical Significance of Cardiac Axis
The cardiac axis helps in detecting abnormalities in the heart’s electrical conduction and can indicate several clinical conditions such as:
Left Axis Deviation may occur in left ventricular hypertrophy, left bundle branch block, or inferior myocardial infarction.
Right Axis Deviation may occur in right ventricular hypertrophy, pulmonary hypertension, or pulmonary embolism.
Extreme Axis Deviation may indicate severe conduction abnormalities or ventricular rhythms.
8.5 Applications of ECG#

For clinical applications, it is advisable to consult an advanced medical textbook, as it provides more reliable information.
Projects using ECG#
You can utilize our BioAmp Hardware to create various applications. We’ve successfully developed multiple applications, so there’s nothing holding you back from creating something innovative and outstanding. A few applications of our devices are highlighted below:
8.6 Advantages of ECG#
Non invasive
Easy and quick to apply
Real time monitoring of cardiac electrical activity
Safe for everyone (including pregnant women and children)
Low cost (especially 12-lead resting ECG)
No radiation exposure
Widely available and standardized worldwide
8.7 Limitations of ECG#
Shows only heart current activity: It records the heart’s electrical signals at that moment, so if the problem is not happening during the test, it may go unnoticed.
Cannot detect all heart issues
Does not show structure of the heart: ECG only checks electrical activity, not the physical structure (like valves or muscles), which may require other tests such as echocardiography.
Requires expert interpretation: A trained doctor must read the ECG, as small changes can be easy to miss or misinterpret.
Affected by external factors: Movement, poor electrode placement, or even body position can cause inaccurate readings.
Limited ability to localize some abnormalities: ECG may not always clearly identify the exact location or cause of certain heart problems, such as small areas of ischemia or early stages of heart disease.
8.8 Summary#
In this module, we learned about ECG/EKG, a non-invasive technique used to record the heart’s electrical activity. We covered basic terms, the working principle, components of the ECG waveform (PQRST), and different types of ECG leads and their placement. The procedure of performing an ECG and its various clinical applications were also discussed. Additionally, we explored our hardware-based ECG projects and understood the main limitations of ECG. Overall, the module highlighted ECG as an essential diagnostic tool in cardiology that must be interpreted along with clinical findings.
Warning
This content is provided solely for educational purposes. Always seek medical advice from a healthcare expert for clinical application.