Chords-LSL-Visualizer#
Overview#
The Chords-LSL-Visualizer is an open-source, Rust-based graphical application for visualizing bio-potential signals streamed over the Lab Streaming Layer (LSL) for Chords. It is designed to work seamlessly with Chords-compatible hardware (such as Neuro Playground Lite or other BioAmp devices running Chords firmware) by subscribing to their LSL streams and rendering live bio-potential signals in an interactive GUI.
With Chords-LSL-Visualizer, you can:
Discover available LSL streams from your connected hardware.
Visualize multi-channel ExG signals (EEG, EMG, ECG, etc.) in real time.
Apply filters to the live data for cleaner signal observation.
Select the number of channels you want to visualize.
Cross-platform compatibility: Windows, macOS, and Linux.
Chords-LSL-Visualizer#
What is Lab Streaming Layer (LSL)?#
Lab Streaming Layer (LSL) is an open-source protocol and software framework for real-time streaming of time-synchronized data, especially in neuroscience and biomedical experiments.
LSL is an open-source networked middleware ecosystem to stream, receive, synchronize, and record neural, physiological, and behavioral data streams acquired from diverse sensor hardware.
To know more about LSL click here.
System Requirements#
Operating System: Windows 10+ / macOS 10.15+ / Linux (glibc 2.27+)
Chords LSL Connector running LSL-enabled firmware (e.g., Neuro Playground Lite).
Hardware Requirements#
USB type-C cable
Or Chords Arduino firmware repository on the Chords Arduino Firmware GitHub.
Setting up the hardware#
Make all the connections according to the hardware you are using, including sensor connections with the development board, body connections with the sensor, and connections from the development board to your laptop.
Installation#
Download the installer from the latest release: Chords LSL Visualizer Release
Choose the installer for your OS:
Fedora →
.rpmDebian/Ubuntu →
.debmacOS →
.dmgWindows →
.msiOr download the source bundle to build yourself
Run the installer for your OS:
Windows (.msi)
Double-click the downloaded .msi file.
If you see a SmartScreen warning, click More Info → Run Anyway.
Proceed through the installer wizard: Next → select install location → Install → Finish.
Fedora (.rpm)
Open a terminal and run:
sudo dnf install Chords.LSL.Visualizer-0.1.0-1.x86_64.rpm
Enter your password and confirm the install when prompted.
After installation, launch Chords LSL Visualizer from your Applications menu.
Debian/Ubuntu (.deb)
Open a terminal and run:
sudo apt install ./Chords.LSL.Visualizer_<version>_amd64.deb
If you hit missing dependencies, run:
sudo apt --fix-broken install
Launch Chords LSL Visualizer
chords-lsl-visualizer
macOS (.dmg)
Double-click the downloaded Chords.LSL.Visualizer.<version>.dmg file.
When you see the macOS warning:
“Chords.LSL.Visualizer.<version>.dmg” was downloaded from the Internet.
Are you sure you want to open it?
click **Open**
Drag Chords LSL Visualizer.app into your Applications folder.
Eject the mounted image and open the app from Applications.
(Optional) Build from source
git clone https://github.com/upsidedownlabs/Chords-LSL-Visualizer.git
cd Chords-LSL-Visualizer
npm i
cargo tauri build
Flashing the Firmware#
To flash the firmware: Use NPG Lite Flasher to flash your desired firmware, to know more visit NPG Lite Flasher documentation.
Visualization of LSL#
Once installed, follow these steps to start visualizing your bio-potential signals:
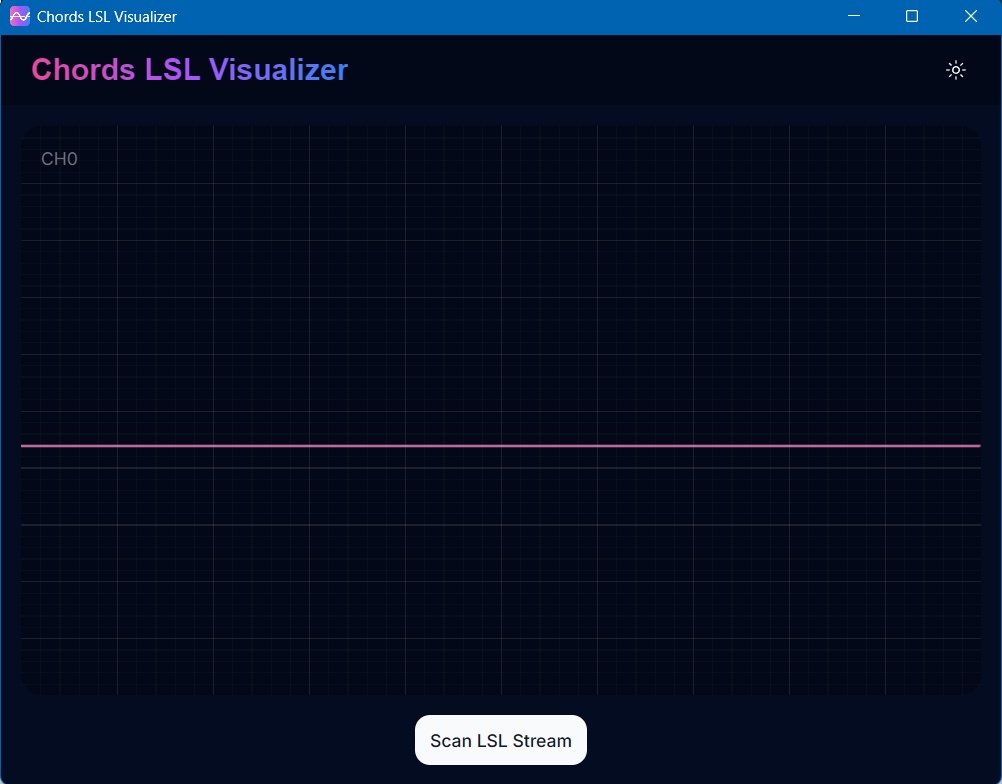
Start Chords-LSL-Visualizer and click Scan LSL Stream. This scans for active LSL streams broadcasted by your Chords LSL Connector or compatible firmware.
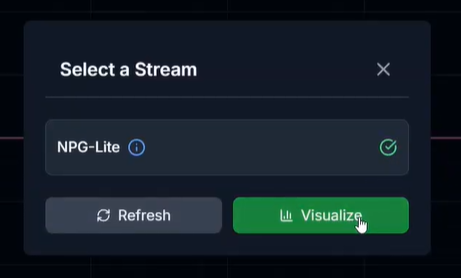
Click Refresh to update the list of available streams.
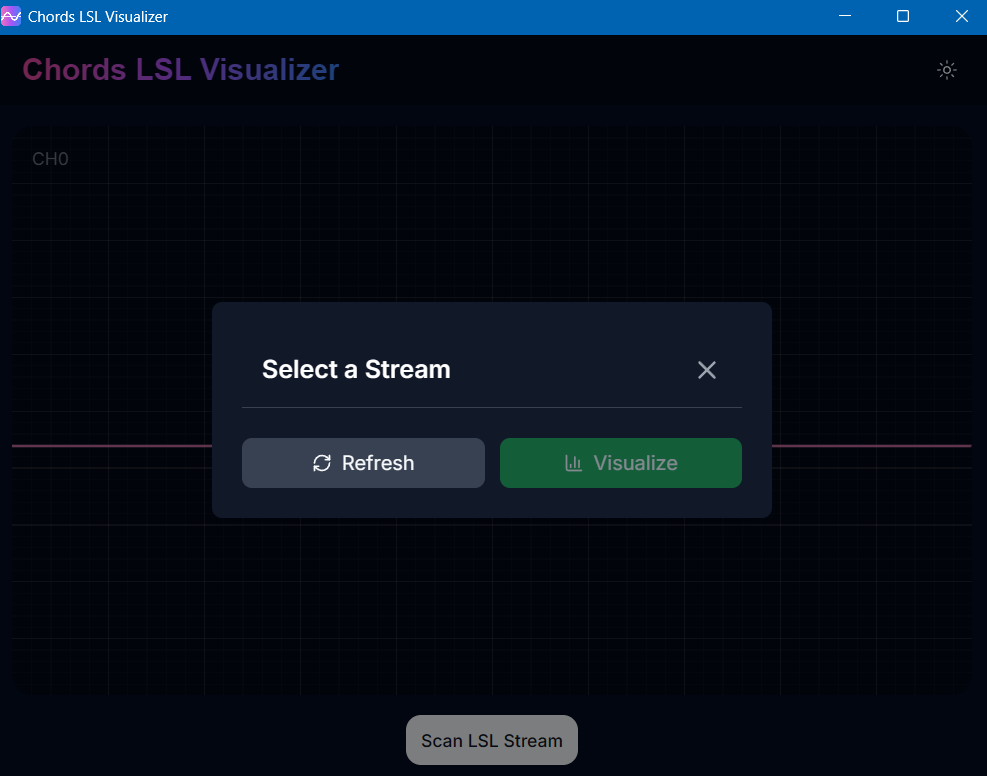
Select your device from the list and hit Visualize.
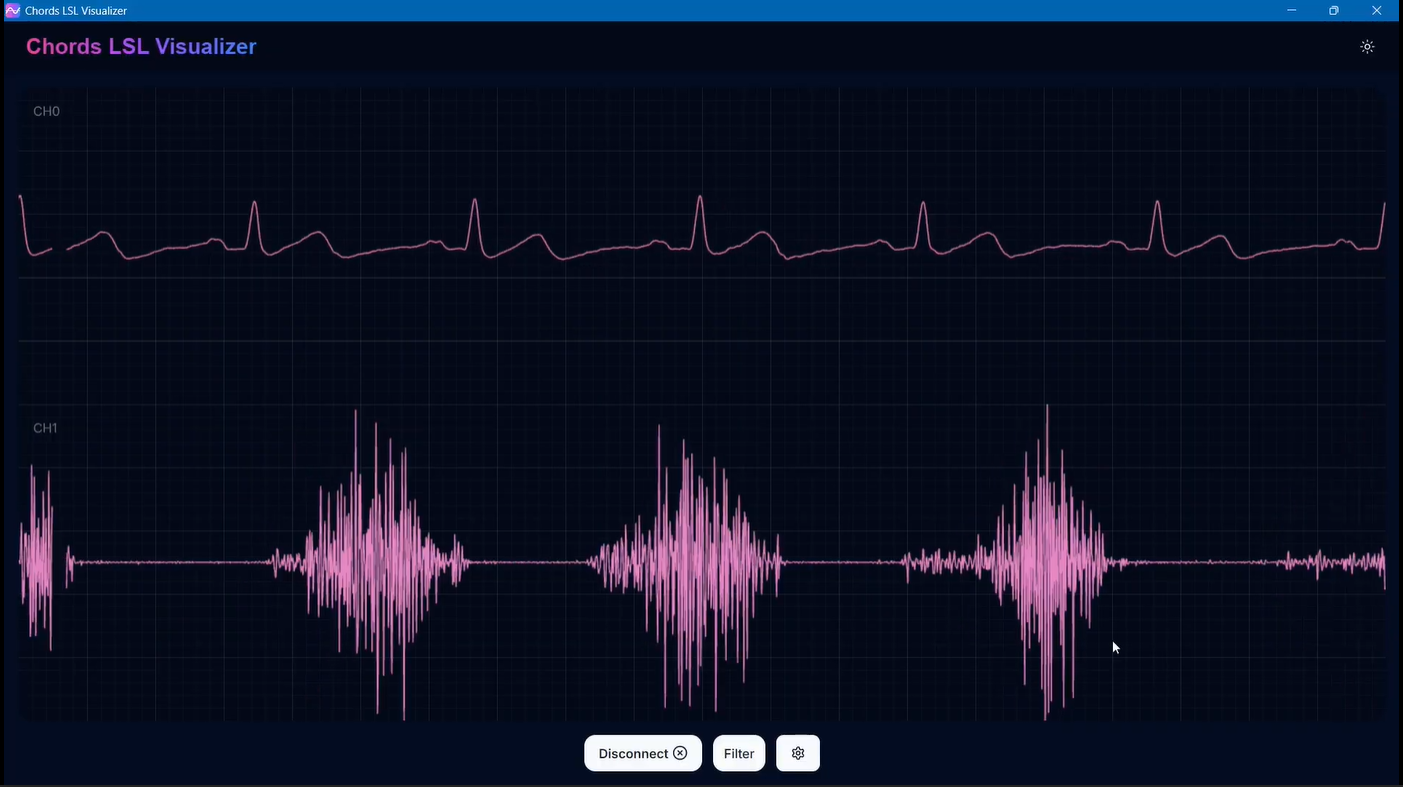
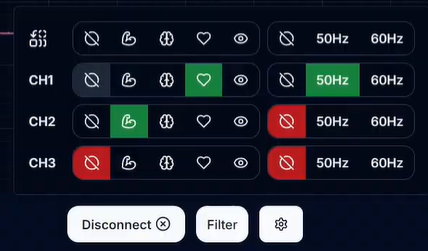
Once the stream starts, choose your filter options (e.g., 50Hz, 60Hz) according to your region.
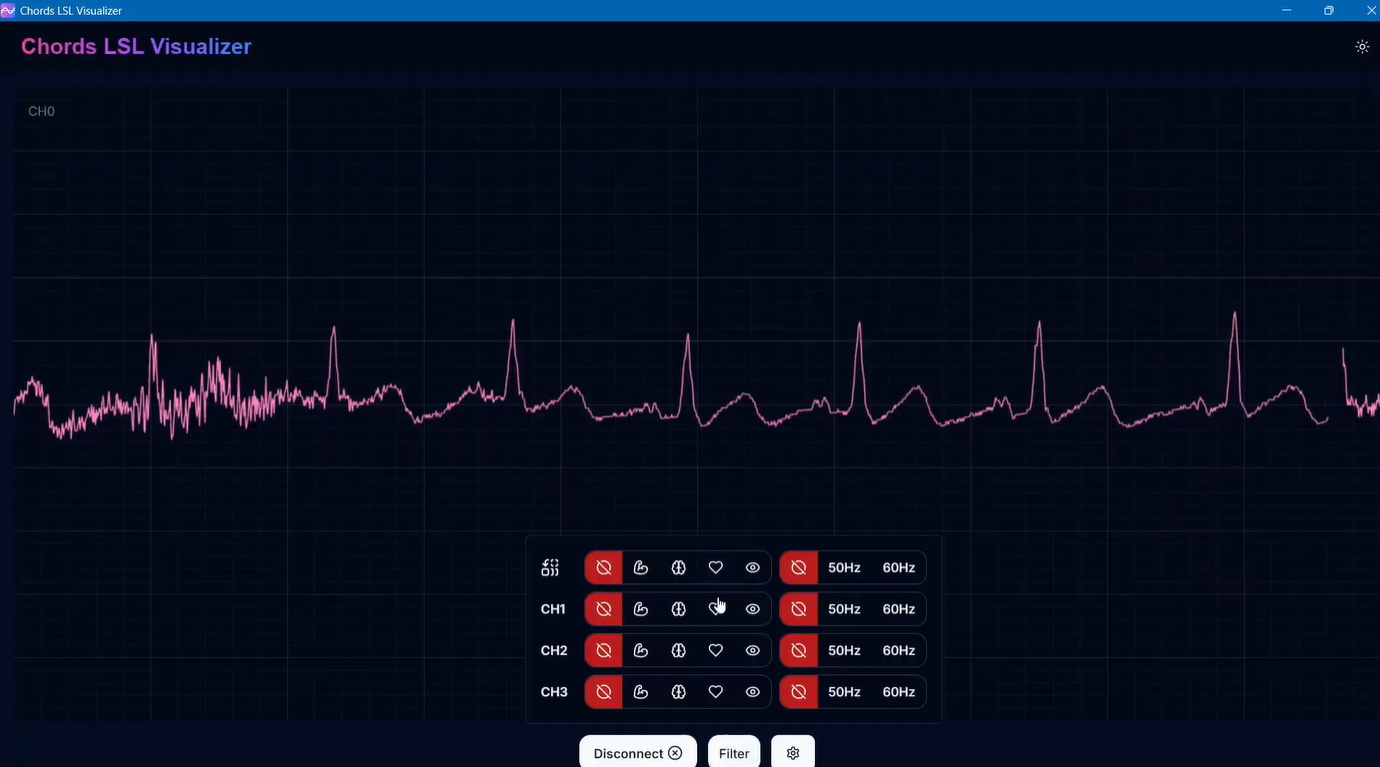
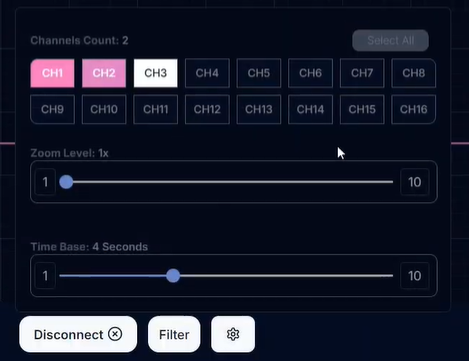
From Settings, select the number of channels you want to visualize.
Begin real-time visualization of your ExG signals.

GitHub Repository#
For full source code, issue tracking, and contribution guidelines, head over to the Chords-LSL-Visualizer GitHub repo.
You’ll discover setup guides and can track ongoing development - including bug fixes and feature enhancements: Chords LSL Visualizer GitHub