Chords-Web#
Overview#
Chords-Web is an open-source web application designed for real-time signal visualization, particularly tailored for bio-potential signals like EEG, EMG, ECG and EOG. This tool serves as an advanced alternative to the standard Arduino IDE serial plotter, offering enhanced functionality for students, researchers and hobbyists alike who want to record biopotential data using BioAmp hardware.
Browser Compatibility#
The web application is compatible with the Web Serial API, which is essential for its functionality. Supported browsers include the latest versions of:
Google Chrome
Microsoft Edge
Opera
If the user’s browser does not support the Web Serial API, a message will inform them of the incompatibility, recommending the use of a supported browser.
For more information, refer to MDN Web Docs on the Web Serial API.
Software Requirements#
Arduino Firmware (Use this software to upload Chords Arduino firmware to your development board).
NPG Lite Flasher (Use this software to upload NPG Lite firmware to your NPG Lite board or any ESP32 based board).
Chromium-based browsers (Know more about Browser Compatibility).
Hardware Requirements#
A development board (see the list of Compatible Development Boards)
A USB cable (type depends on board)
BioAmp Hardware and its accessories
Setting up the hardware#
Make all the connections according to the hardware you are using, including sensor connections with the development board, body connections with the sensor, and connections from the development board to your laptop.
Uploading the code#
Connect your Arduino board to the laptop using a USB cable.
Open the Arduino Firmware for your board in the Arduino IDE.
Navigate to Tools > Board and select your board.
In the tools menu, choose the correct COM port (the one that disappears when the board is disconnected).
Upload the code and open Chords-Web in your web browser.
Once ready, upload the firmware to your development board. Visit the Chords Arduino Firmware GitHub repository, scroll to the supported boards table, locate your board, and click on the corresponding Arduino sketch.
Copy the sketch, paste it into the Arduino IDE, go to Tools, select your board and the correct COM port, then click the upload button.
To learn about how to flash the code on the NPG Lite Board, checkout:
Opening Chords-web#
Open a Chromium-based browser like Google Chrome, Microsoft Edge, Opera, brave, etc.
Search chords.upsidedownlabs.tech .
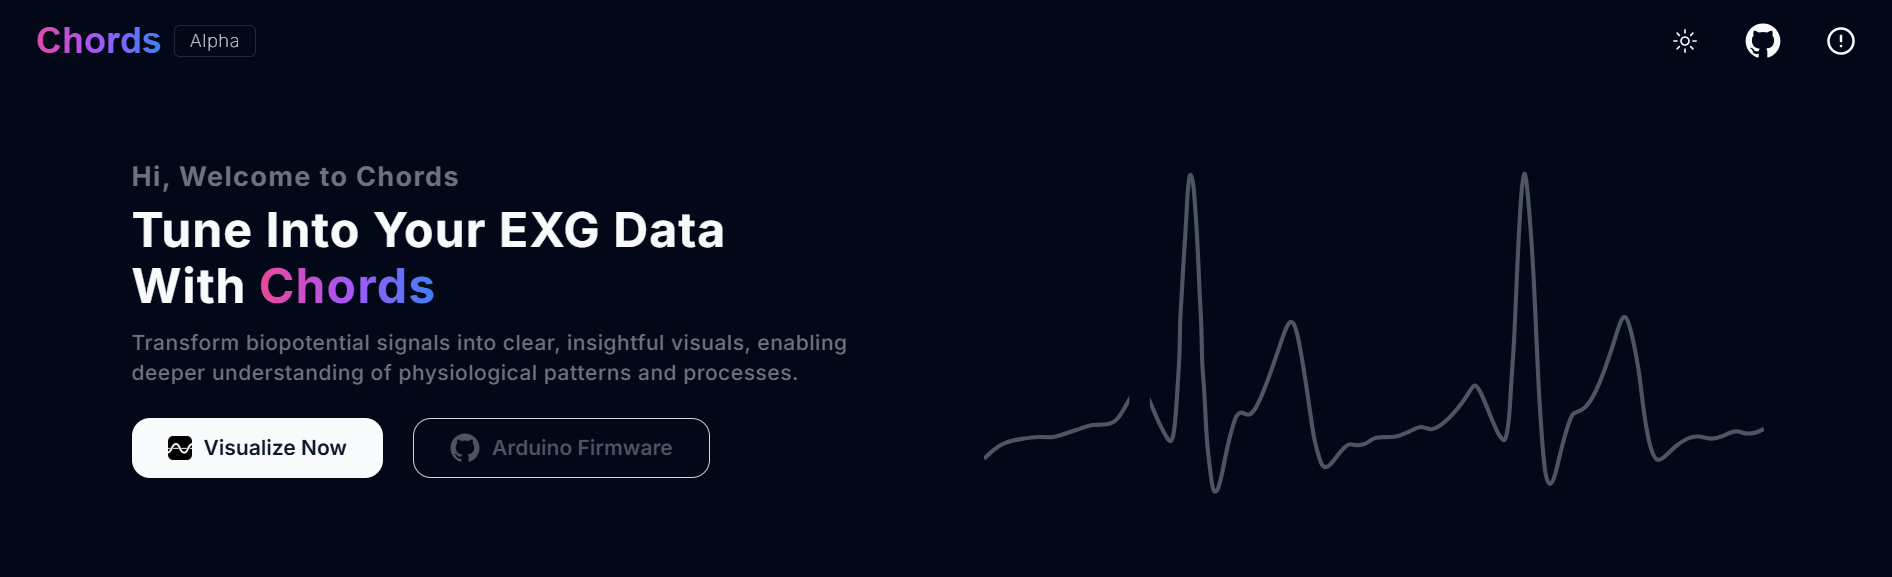
Click on visualize now.
The images in the center show an overview of your hardware connections so far.
At the bottom, you can see buttons to access various applications, which are discussed below:
Applications#
Chords Visualizer#
The Chords Visualizer is a powerful web-based tool designed for seamless real-time biopotential signal acquisition and analysis. Designed for researchers, developers, and enthusiasts, this app provides an intuitive interface for monitoring multiple channels, applying advanced filters, and managing recorded data efficiently. Whether you’re analyzing EMG, ECG, EOG, or EEG signals, the app ensures a smooth and interactive experience, simplifying data acquisition and enhancing signal interpretation.
Features#
Feature |
Description |
|---|---|
Effortless Connectivity |
Instantly detects BioAmp Hardware running Chords-Web Arduino Firmware, simplifying setup and ensuring smooth workflow from data acquisition to visualization. |
Real-time Visualization |
Experience smooth, real-time data rendering powered by WebGL-Plot. Ensures uninterrupted signal display for seamless data monitoring. |
Frame Buffer & Snapshots |
Stores the last five snapshots, with left/right controls for navigation. Changing the channel count resets snapshots for accuracy. Users can zoom in and out for detailed or broad views. |
Recording & Data Management |
Record data in CSV format indefinitely or with a timer. Manage files via a popover menu and download or delete them individually or as a ZIP with one click. |
Zoom & Time Base |
Use Zoom-In & Zoom-Out controls to focus on signal details. Adjust the Time Base Slider from 1 to 10 seconds per frame for flexible data visualization. |
Filter Options |
Enhance biopotential signals using the notch filter and bandpass filters. Apply them individually per channel or collectively via the master filter. |
Channel Support |
Supports real-time multi-channel plotting with color-coded streams. Accommodates up to 16 channels, depending on the connected device, for flexible bio-potential signal applications. |
One-Click Disconnect |
Easily disconnect from the development board with a single click, ensuring a hassle-free disconnection process after data collection or visualization. |
Chords-Web Icons#
Chords-Web Icons#
Play/Pause Data Stream#
Clicking the pause button displays the last saved frame.
You can view and save up to the last five snapshots of your data.
Snapshots are automatically captured per frame.
Navigate snapshots using the left and right buttons.
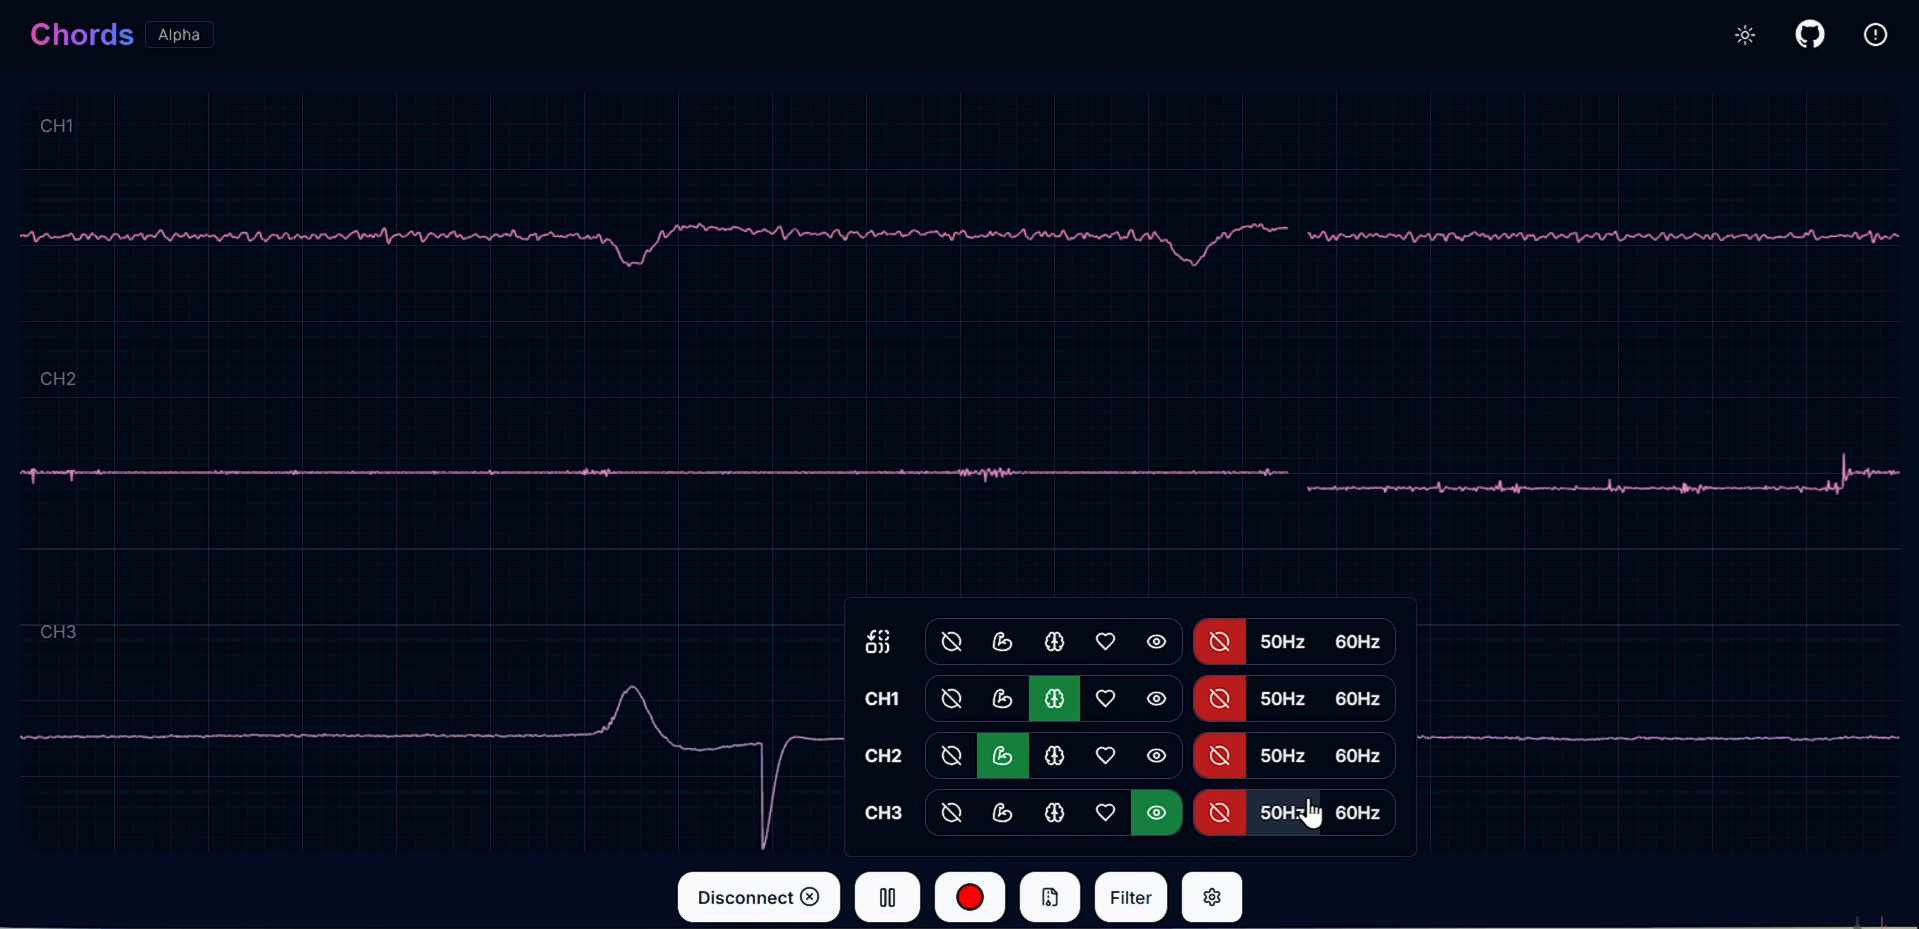
Setting Channel Count#
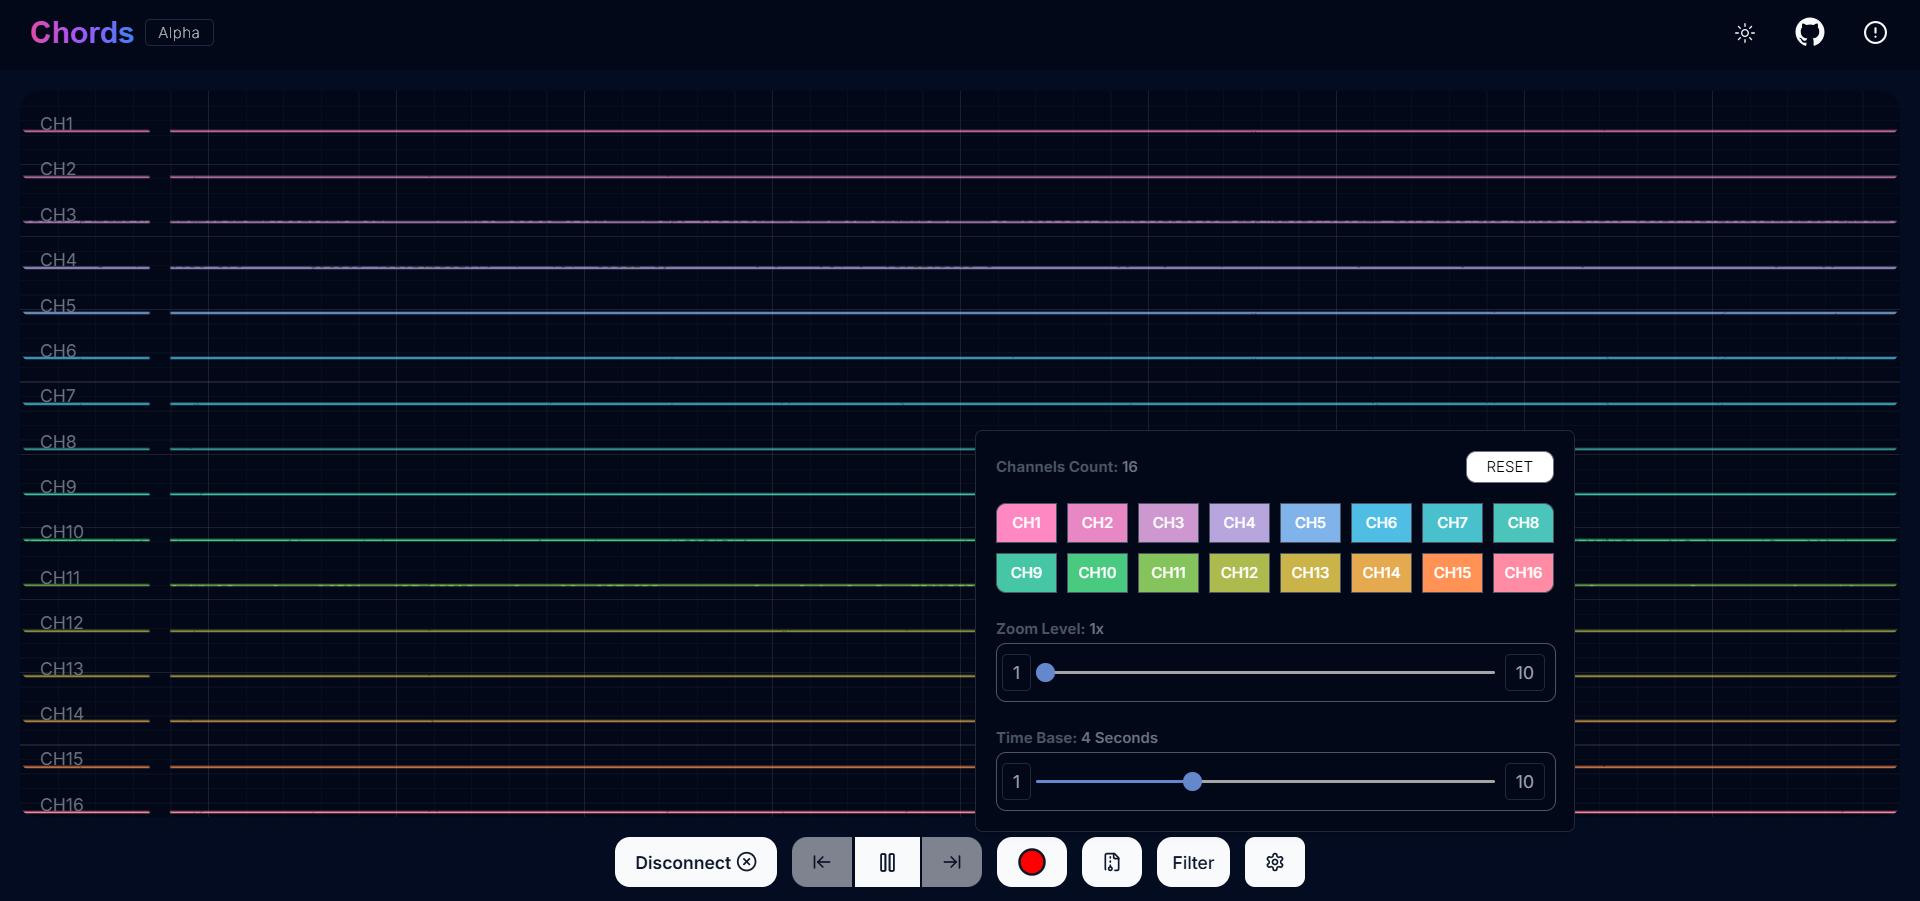
Chords-Web Channel Support#
The number of available channels depends on the development board in use.
Select a specific channel by clicking the channel button.
Use the “Select All” button to choose all available channels at once.
Click the reset button to revert to your previously selected channels.
Recording the Data#
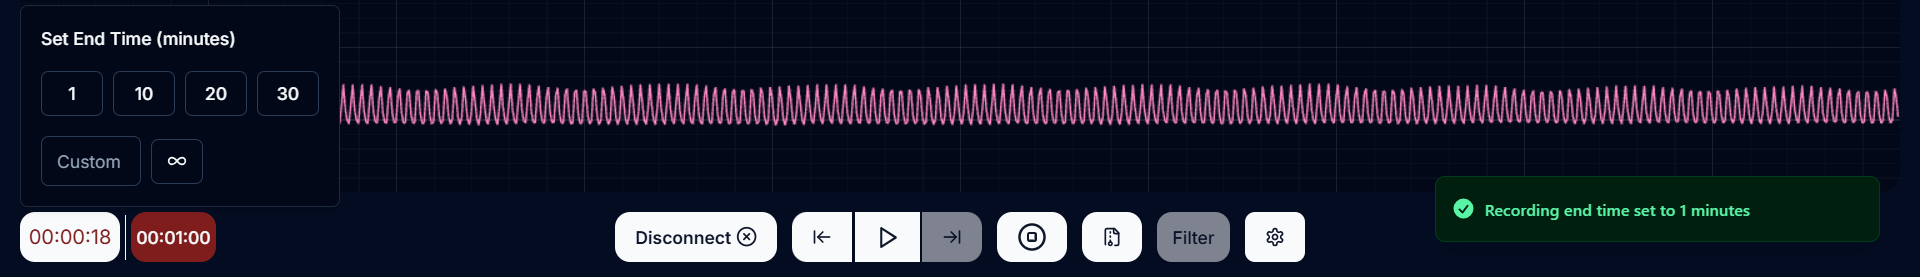
Recording Time#
Record data in CSV format for a set duration or indefinitely until manually stopped.
Start recording with a set time limit or record freely and stop anytime using the stop icon.
Efficiently download or delete recorded files through the popover menu.
Files are securely stored in IndexedDB for seamless management.
Manage individual files by downloading specific files and removing them as needed.
Easily download all files as a ZIP or delete them with a single click for seamless file management.
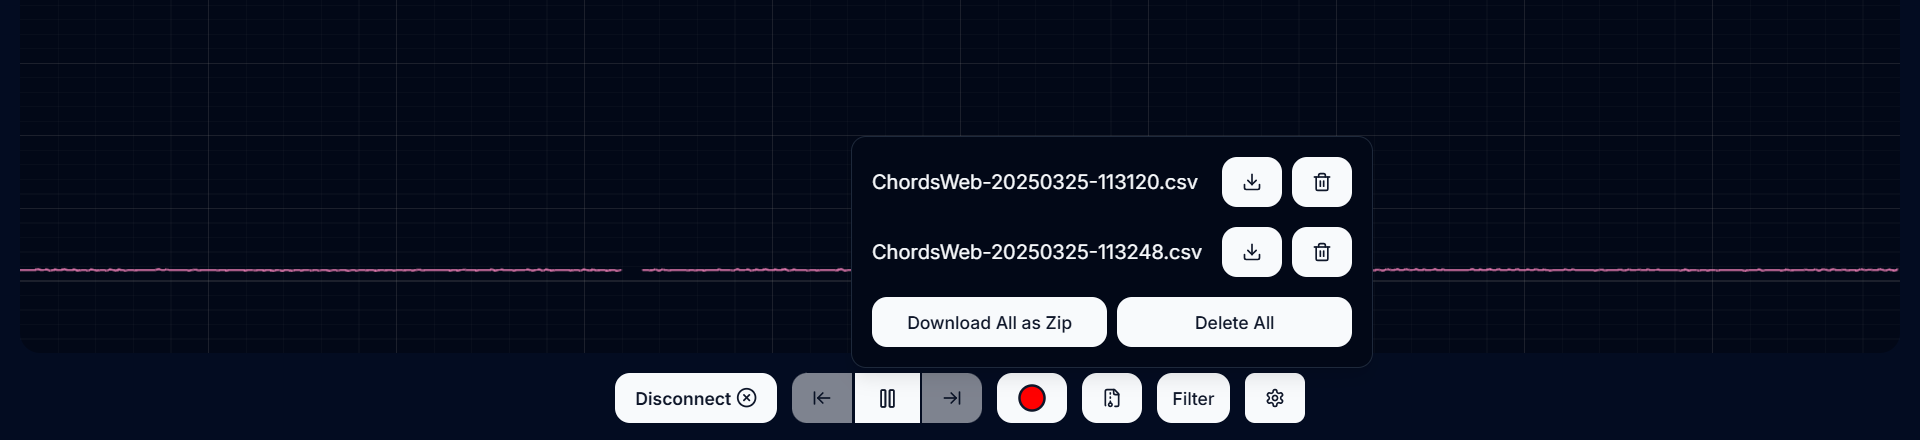
Save and Delete Option#
Visualizing EMG (Electromyography) signal#
EMG captures the electrical activity produced by skeletal muscles.
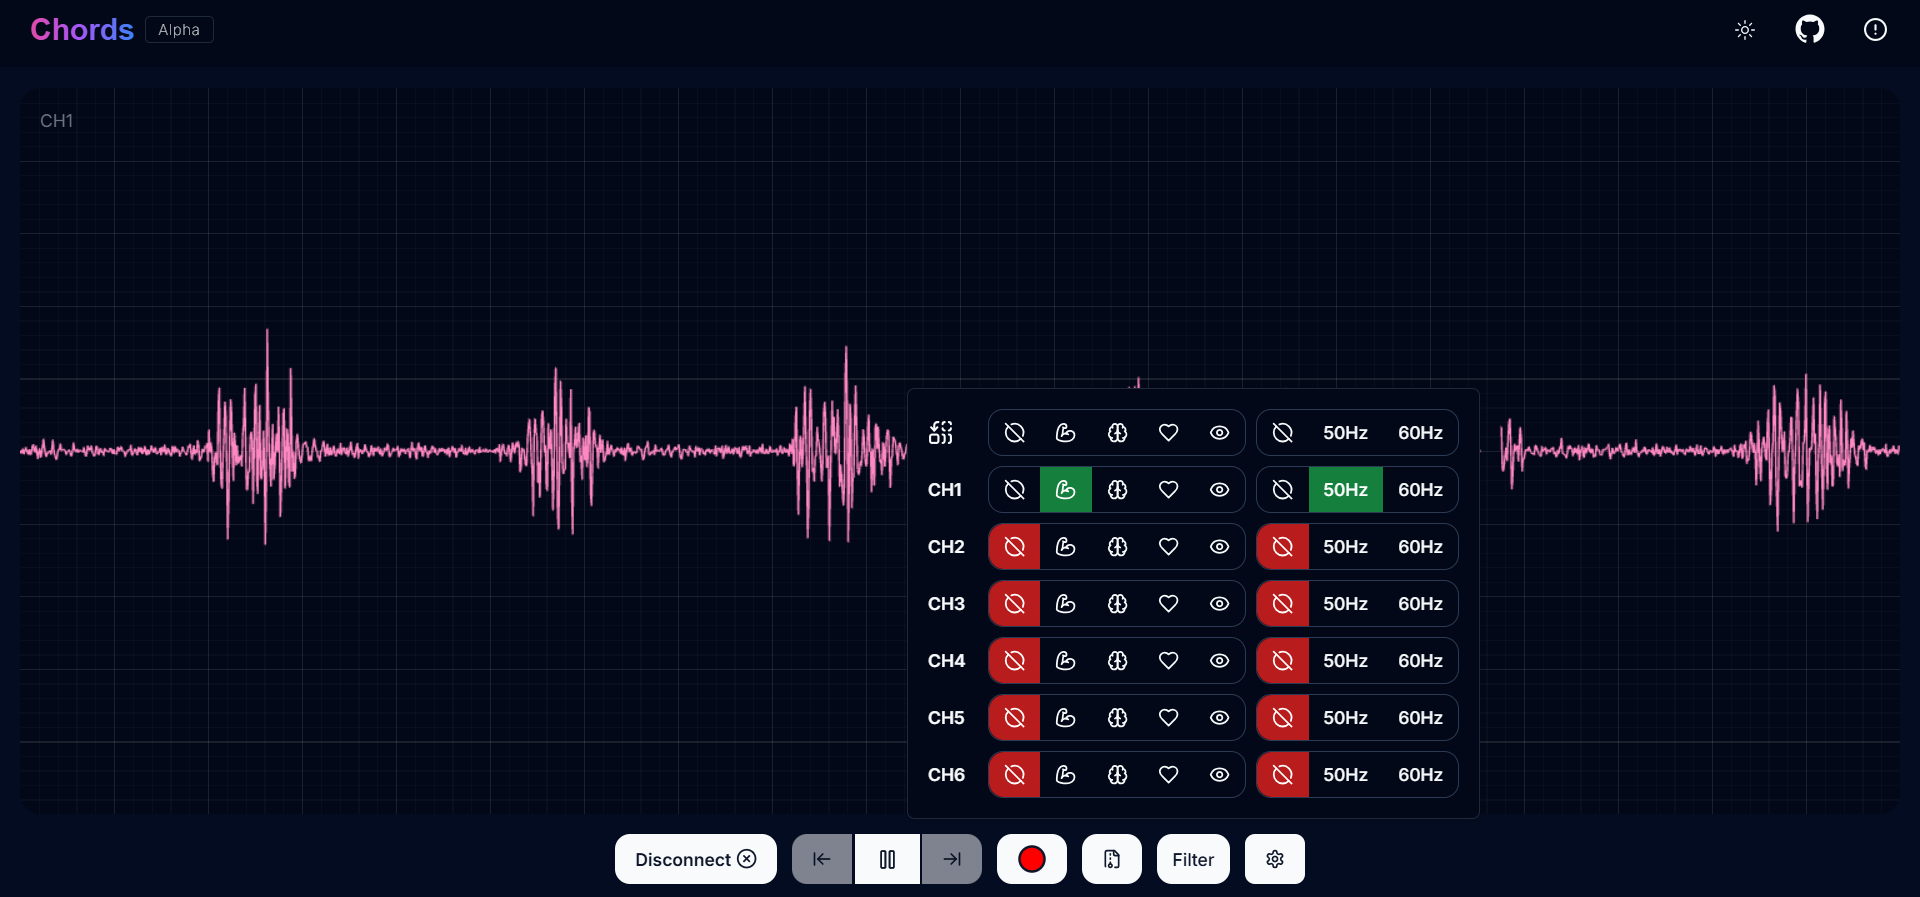
EMG Signal Example#
Visualizing EEG (Electroencephalography) signals#
EEG records the electrical activity of the brain and is commonly used for diagnosing neurological conditions and studying brain activity.
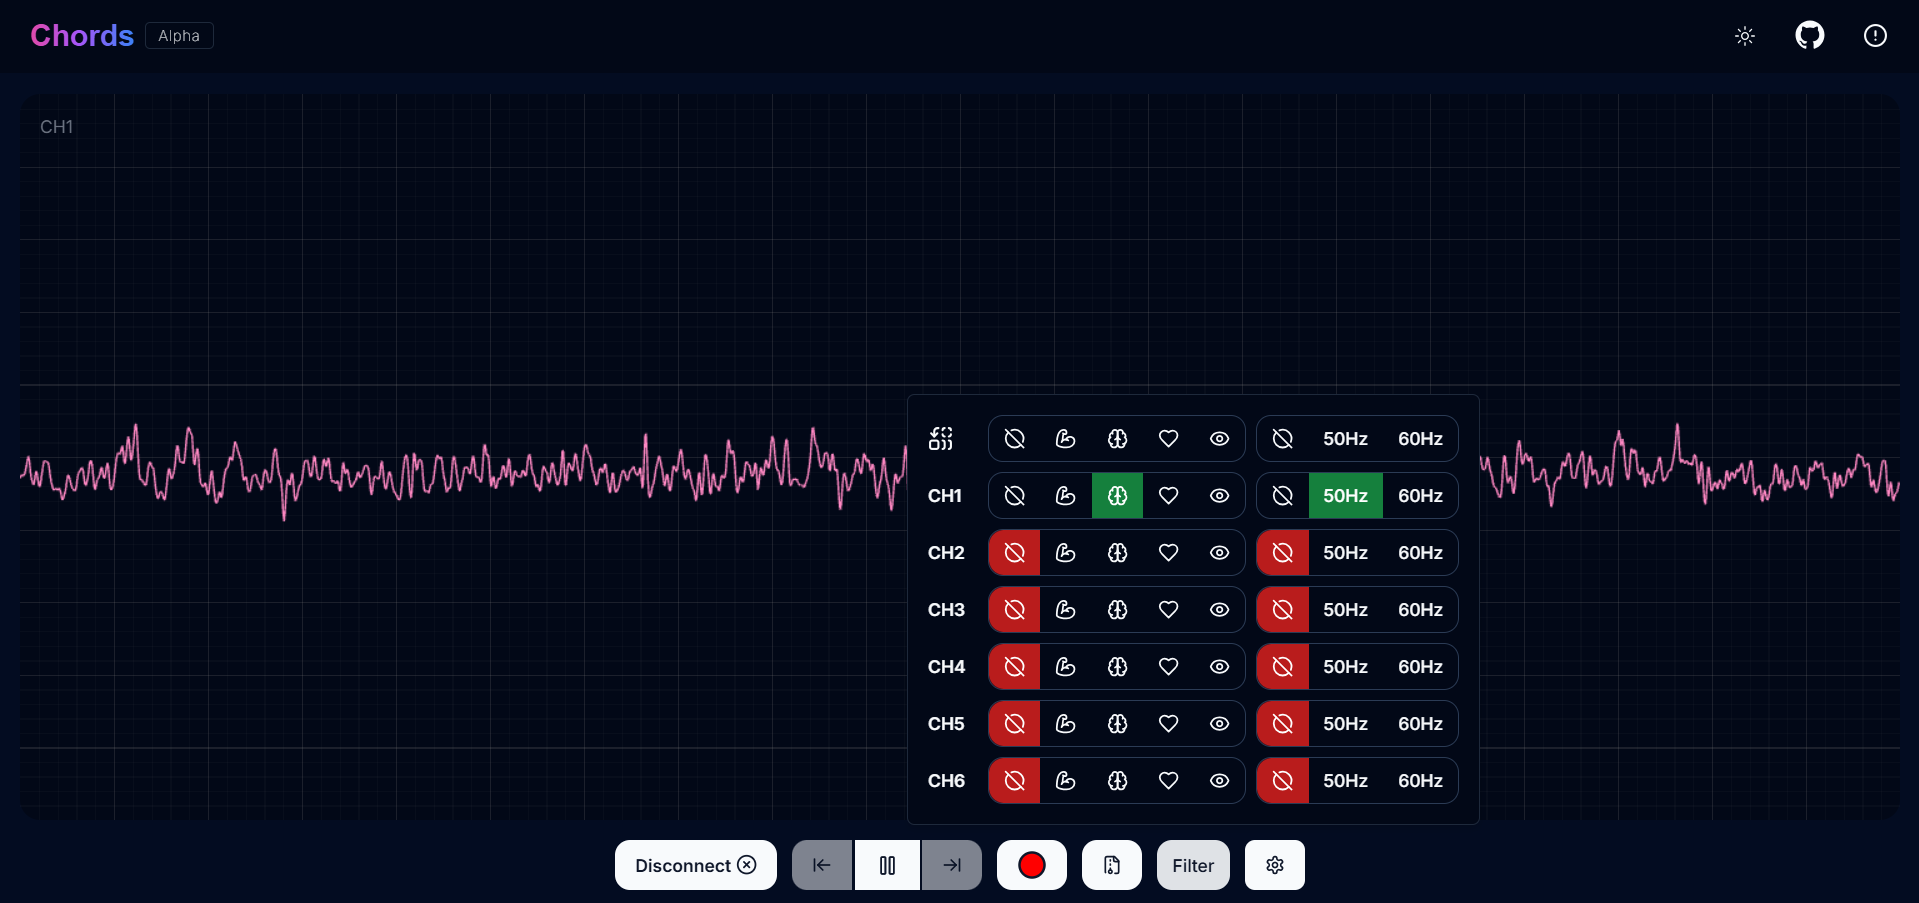
EEG Signal Example#
Tip
To ensure you’re recording a high-quality signal, refer to the detailed guide here: Troubleshooting EEG Signal Quality.
Visualizing EOG (Electrooculography) signals#
EOG measures the electrical potential generated by eye movements.
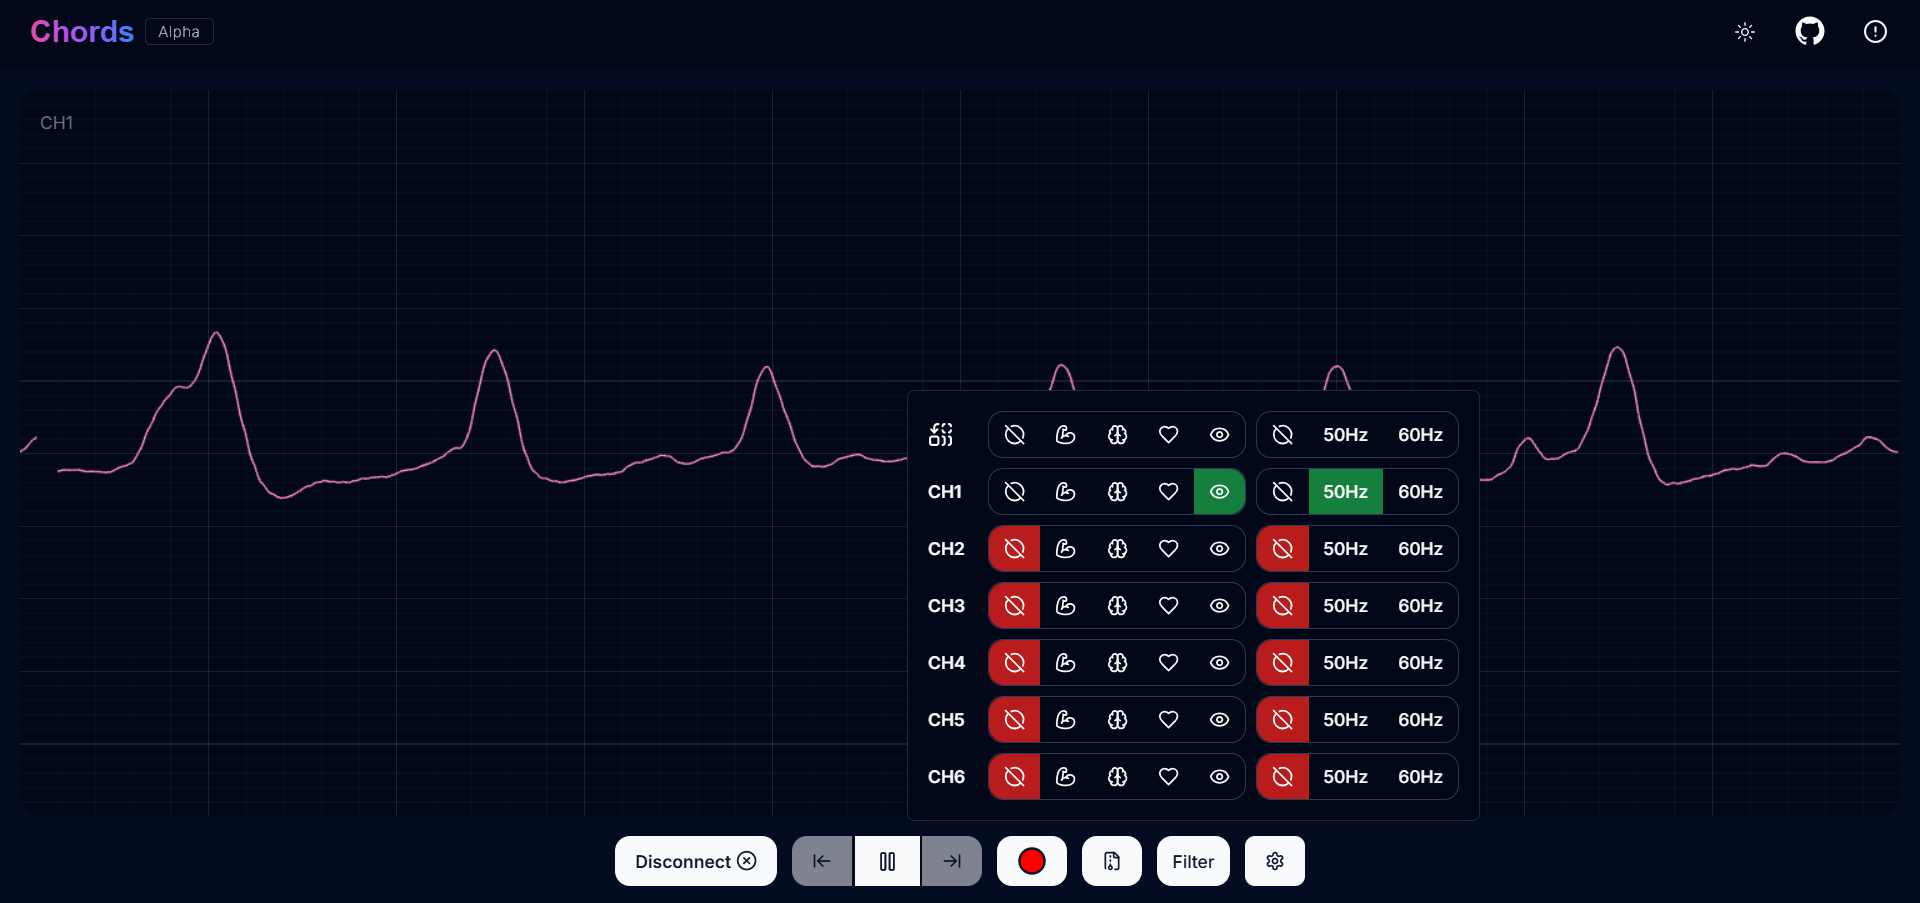
EOG Signal Example#
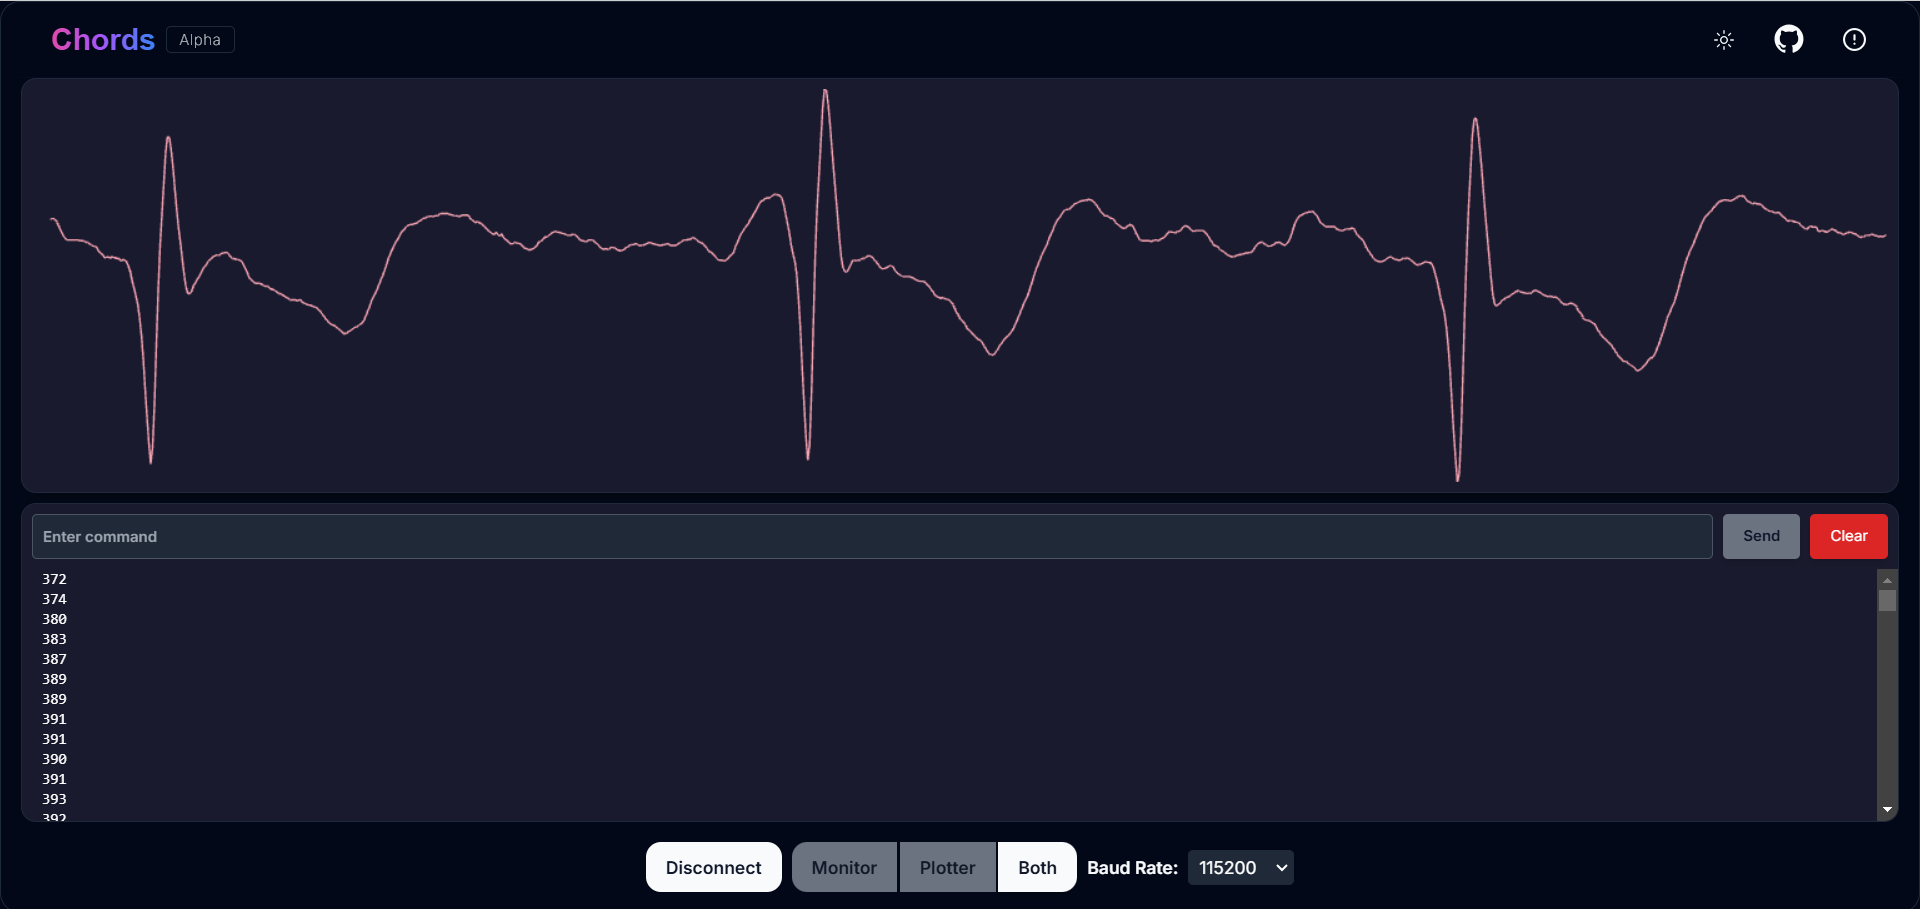
Visualizing ECG (Electrocardiography) signals#
The ECG (Electrocardiography) signal represents the electrical activity of the heart. This custom ECG signal is used both in clinical practice and research to evaluate heart rhythm, detect abnormalities, and assess cardiac health.
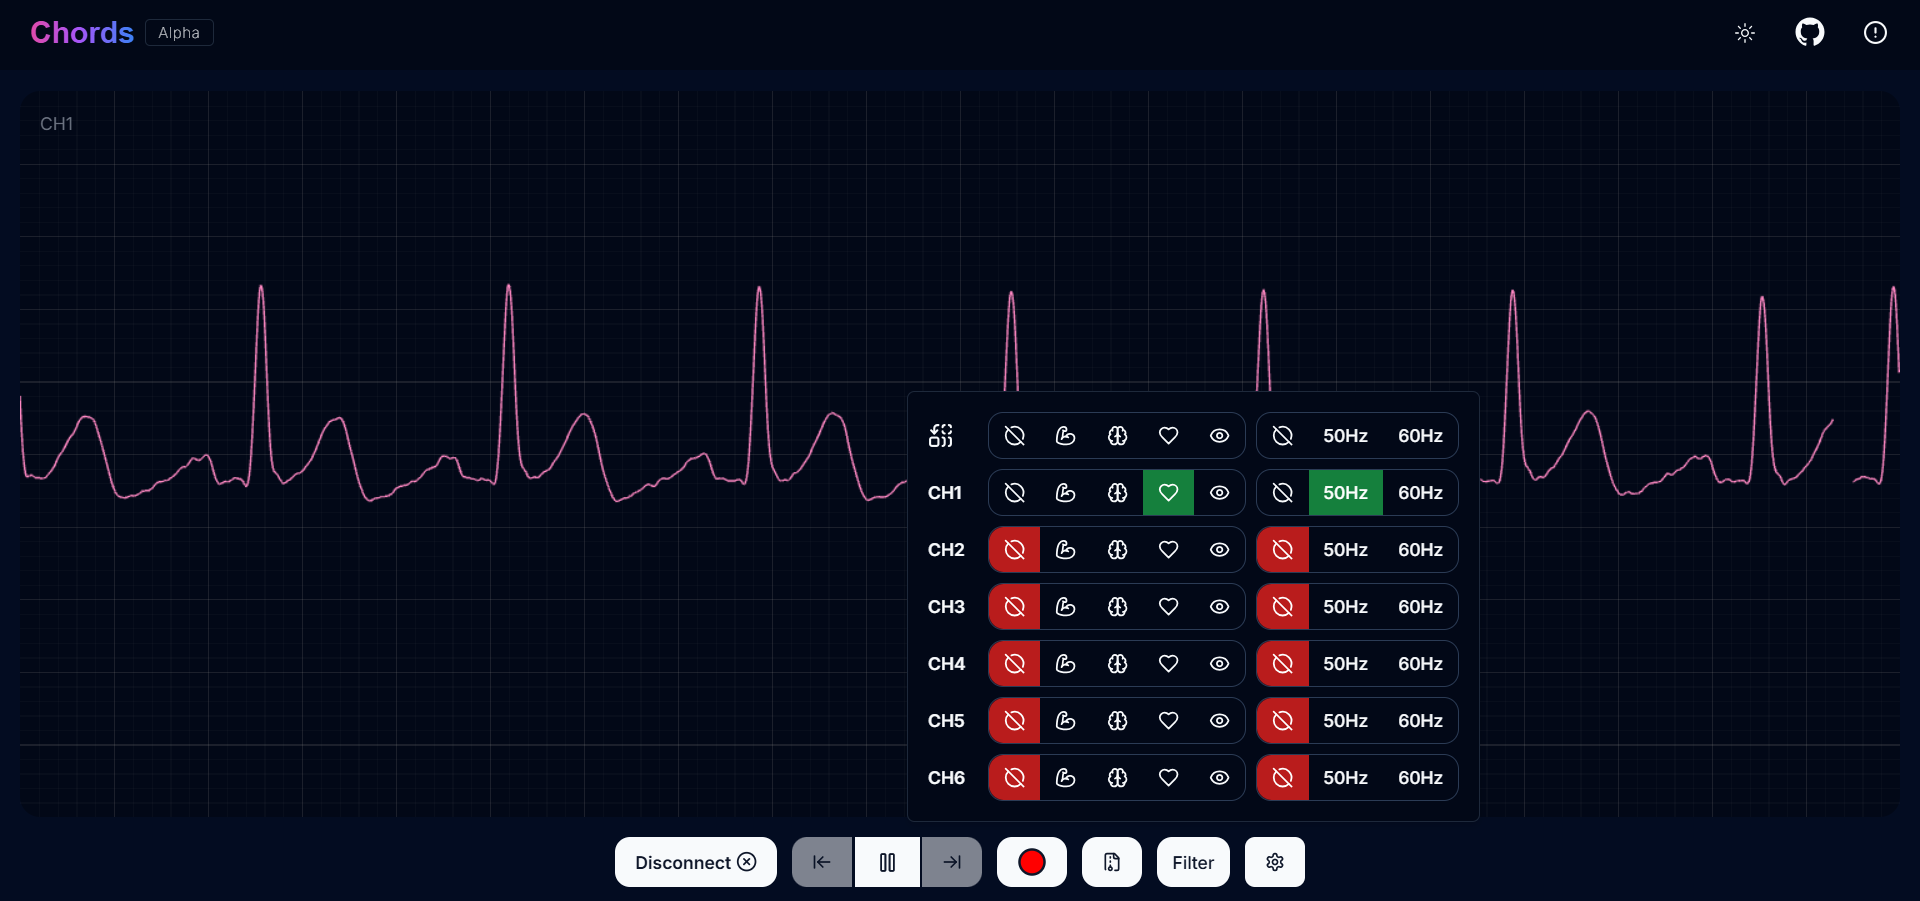
ECG Signal Example#
Other Options to Explore#
Switch Theme Quickly switch between light and dark modes using the theme button in the navigation bar.
Visit the GitHub Repository Access the Chords Web GitHub repository via the link in the navigation bar.
Contributors View the list of contributors using the link in the navigation bar’s top-right corner.
Running the Application#
Click the
Visualize Nowbutton to navigate to the applications page. Here, you will find two options.Click the
Chords Visualizerbutton to establish a connection with the Arduino and start streaming data.Use the
ZoomIn/ZoomOutbuttons to adjust data visualization.Use the
Play/Pausebutton to control the data stream. Navigate the last five snapshots with theLeft/Rightbuttons in the Frame Buffer feature.Click the
Recordbutton to start recording data into a CSV file.Click the
Downloadbutton to save the recorded data.Click the
Deletebutton to remove recorded data.Click the
Filterbutton to apply filters for EMG, ECG, EOG, and EEG signals: -Muscle(70Hz high-pass for EMG) -Heart(30Hz low-pass for ECG) -Eye(10Hz low-pass for EOG) -Brain(45Hz low-pass for EEG) - Use the Master button to apply filters across all channels. - Apply 50Hz or 60Hz filters to individual or all channels.Select channels via the
Channelsbutton in the settings popover.Adjust zoom using the
Zoomslider for a detailed or overall view.
Serial Wizard Plotter & Monitor#
Overview#
The Serial Wizard Plotter & Monitor is a standalone feature within Chords-Web that provides real‑time serial data visualization.
Chords-Web Filter#
Features#
Feature |
Description |
|---|---|
Dual View Modes |
This tool allows you to toggle between the Plotter, Monitor, or a combined view for comprehensive visualization. |
Optimized Data Rendering |
In newer Arduino versions, fast data plotting can lead to cluttered displays. The Serial Plotter & Monitor is optimized to handle high-frequency data, ensuring clear and accurate visual representation. |
Footer Button Bar |
Easily switch between different viewing modes using an intuitive footer button bar. |
Baud Rate Selection |
Choose from multiple baud rates to optimize serial communication based on your device’s requirements. |
Navigation Bar |
Access features such as theme switching (light/dark), visit the GitHub repository, view contributor details, or return to the previous page. |
Running the Application#
Click the Serial Wizard button to launch the Serial Plotter & Monitor.
Click on Connect button select board.
Use the footer button bar to toggle between the Plotter, Monitor, or a combined view.
Navigate using the top bar to switch themes, visit the GitHub repository, view contributors, or return to the previous page.
Note
Checkout our YouTube video for more information:
FFT Analysis and EEG Band Spectrum Plotting#
Overview#
We have introduced FFT (Fast Fourier Transform) analysis and EEG band spectrum plotting to improve real-time signal processing. These features enable you to visualize and analyze EEG frequency bands, providing deeper insights into brain activity.
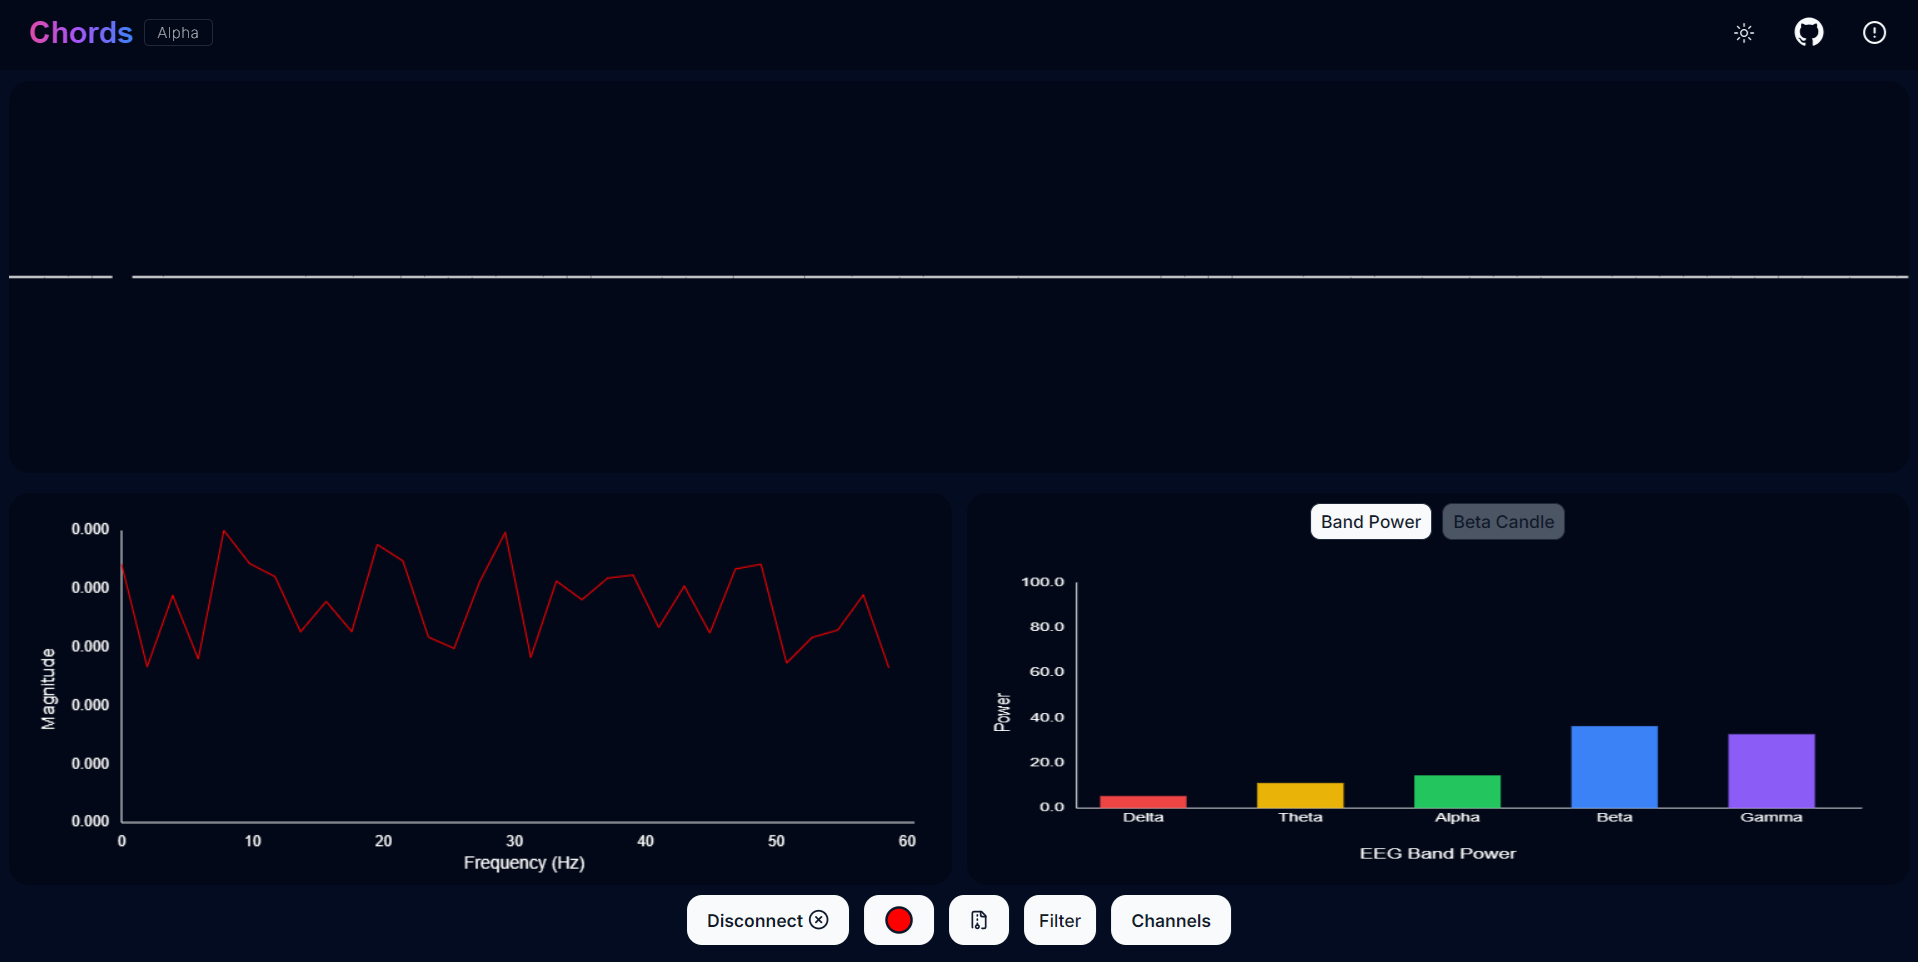
Chords-Web FFT Visualiser#
Features#
Feature |
Description |
|---|---|
Download EEG Data |
Save recorded channel data as a CSV file for further analysis, storage, or external visualization. |
Live EEG Band Monitoring |
View real-time plots of EEG band values for better brain activity tracking. |
Channel Selection |
Toggle individual channels (CH0-CH2) on or off to customize which electrode inputs are displayed and recorded. |
Supported EEG Bands#
Delta (0.5 - 4 Hz) → Associated with deep sleep and unconscious states.
Theta (4 - 8 Hz) → Linked to relaxation, meditation, and light sleep.
Alpha (8 - 13 Hz) → Reflects calm, wakeful relaxation, often seen during closed-eye rest.
Beta (13 - 30 Hz) → Related to active thinking, problem-solving, and focus.
Gamma (30 - 45 Hz) → Involved in high-level cognitive functioning, attention, and perception.
Running the Application#
Select “FFT Visualizer” to see your brainwaves in real time.
You will get two option, select the appropriate option based on how your device is connected:
Serial
Bluetooth
The top segment displays filtered EEG data using a 45Hz low-pass filter to remove noise.
The bottom segment is divided into two sections:
Left side → Shows EEG frequency values in Hz.
Right side → Offers two interactive modes:
Band Power Mode → Displays real-time EEG band power values.
Beta Candle Mode → A unique visualization where a glowing candle represents your focus level.
Brighter candle = Higher beta waves = Strong focus.
Dim candle = Lower beta waves = Distraction.
Note
Checkout our YouTube video for more information:
NPG Lite#
Overview#
We have added support for NPG Lite, enabling real-time visualization of signals directly from the onboard 3-channel BioAmp. Powered by the ESP32-C6 with a built-in 12-bit ADC, setup is seamless: simply upload the firmware, power on the board, and begin streaming instantly.
Chords-Web NPG Lite#
Features#
Feature |
Description |
|---|---|
Wireless Bluetooth LE |
Stream up to 3 channels of biopotential data over BLE - no cables after initial power-on. |
Built-in BioAmp & 12-bit ADC |
On-board amplifier and ESP32-C6 ADC ensure high-quality signal capture. |
Interactive Controls |
Select channels, play/pause live stream, apply bandpass & 50/60 Hz notch filters, and record to CSV. |
Running the application#
Flash the correct firmware - Visit the NPG-Lite Flasher and upload the BLE firmware to your board.
Open Chords-Web - Navigate to https://chords.upsidedownlabs.tech and click Visualize Now.
Select “NPG-Lite” - From the application list, choose NPG-Lite.
Enable Bluetooth on your computer - Turn on your system’s Bluetooth, then click Connect in Chords-Web.
Choose your device - Select your NPG-Lite from the list of available devices.
Begin streaming - Visualize your biopotential signals in real time, select 1-3 channels, toggle play/pause, apply filters, or record to CSV.
Use Cases#
Neurofeedback & Focus Training: Monitor alpha/beta power to track attention.
Rehabilitation & Sports Science: Quantify muscle (EMG) activity during exercises.
Research & Education: Capture synchronized EEG/ECG/EOG data for analysis.
Note
Checkout our YouTube video for more information:
Rep Forge#
Overview#
We’ve added Rep-Forge - a real-time, 3-channel EMG visualization tool for the NPG Lite. Rep-Forge lets you monitor your muscle strength as you work out or rehabilitate, directly in your browser. No external ADC or development board required: simply flash your firmware, apply electrodes, and start streaming.
Features#
Feature |
Description |
|---|---|
3-Channel EMG Streaming |
Stream up to three simultaneous EMG signals from your NPG Lite’s onboard BioAmp. |
Intelligent Channel Detection |
Automatically highlights the active muscle channel so you can quickly identify which muscle you’re engaging. |
Live Strength Bars |
Dynamic bar graphs update in real time to show relative contraction levels for each channel. |
Noise-Reducing Filters |
Built-in signal filters remove 50/60 Hz mains interference and high-frequency artifacts for a cleaner EMG trace. |
Wireless BLE Connectivity |
Stream data over Bluetooth LE—no cables needed once your board is powered on. |
Running the application#
Power on your NPG Lite by flipping its on/off switch.
Connect via USB-C and flash the Rep-Forge firmware using the NPG Lite Flasher.
Unplug USB and enable Bluetooth on your computer (or use Serial/Wi-Fi as needed).
Open your browser to chords.upsidedownlabs.tech, click Visualize Now, then choose Rep-Forge.
Click Connect, select your NPG Lite device from the list, and wait for the live EMG bars to appear.
Place electrodes on the target muscle group; watch Rep-Forge dynamically highlight and plot the active channel’s strength.
Use Cases#
Strength Training: Quantify muscle activation during lifts or repetitions.
Rehabilitation: Monitor recovery progress in injured muscle groups.
Research: Capture high-quality EMG data for neuromuscular studies.
Technologies Used#


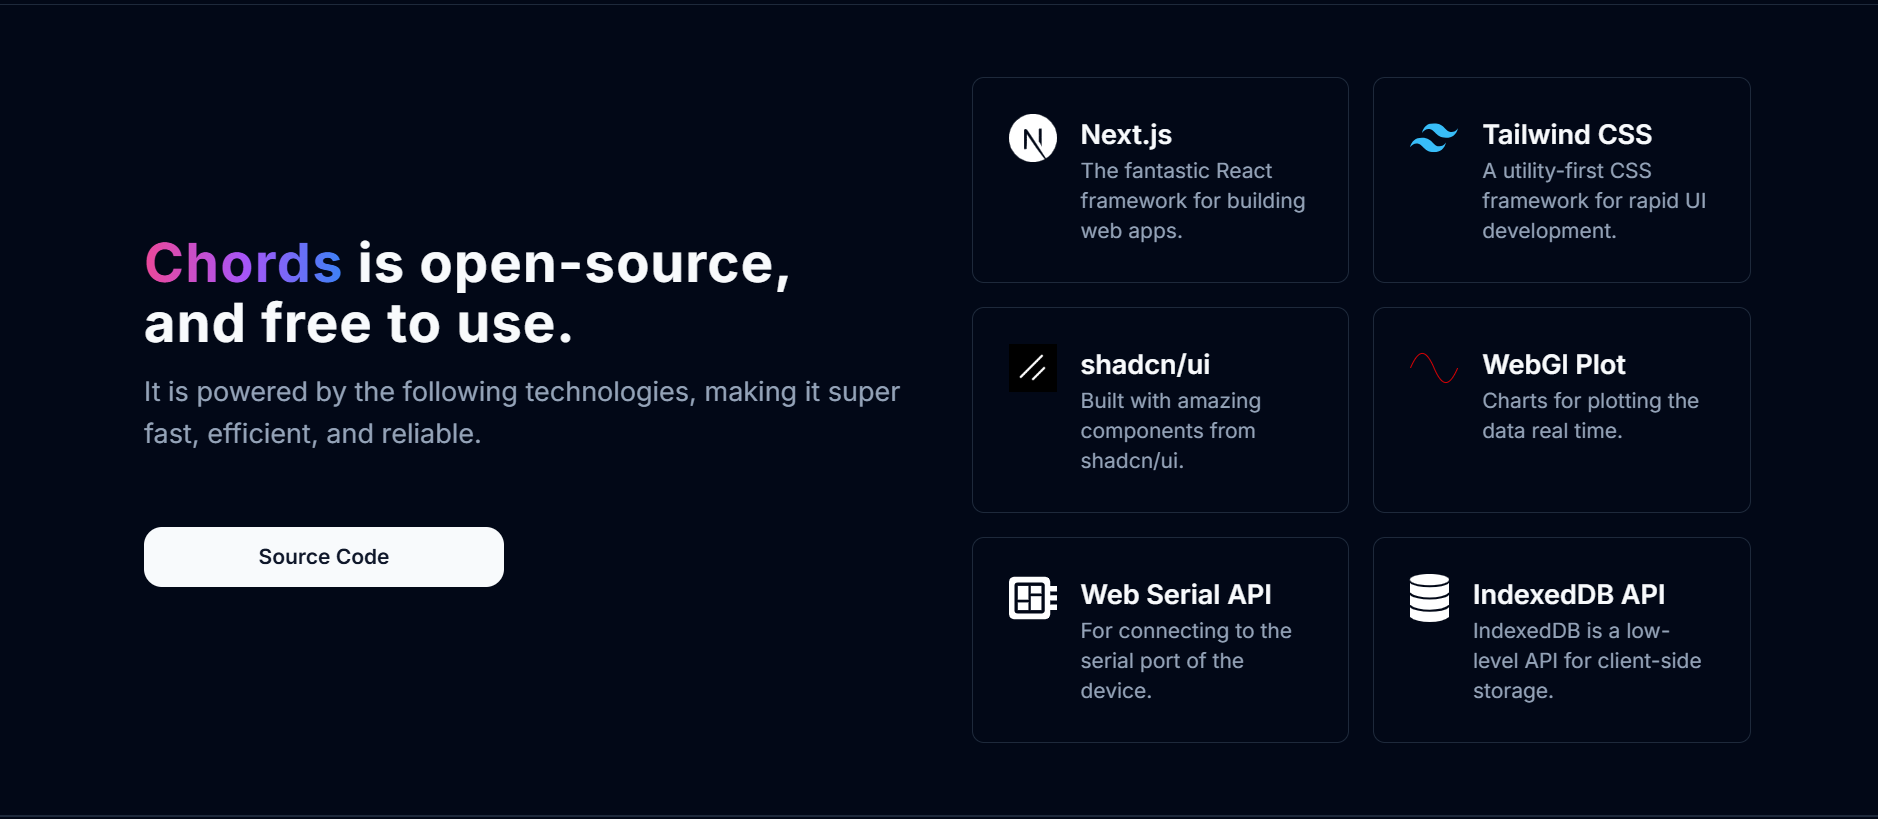
Chords-Web Tech Stack#