Chords-Python#
Overview#
Chords-Python is an open-source bag of tools for recording biopotential signals like ECG, EMG, EEG, or EOG, along with visualization using BioAmp hardware. It’s ideal for educational purposes as it promotes DIY Neuroscience and makes biopotential signal exploration more accessible for students and researchers.
Features#
Feature |
Description |
|---|---|
Connection |
Supports both wired and wireless connections via Wi-Fi, Bluetooth, or USB (Serial). |
Data Reading |
Reads data packets from development board in real-time, efficiently processing them to prevent data loss and ensure accurate signal representation for analysis and visualization. |
CSV Logging |
Optionally logs incoming data to a CSV file with columns for counter and channel data, enabling easy storage, analysis, and sharing. |
LSL Streaming |
Streams data via Lab Streaming Layer (LSL), a protocol for time-synchronized data sharing. Enables real-time analysis, visualization, or integration with tools like BrainVision. |
Applications |
Provides an interface to run multiple applications simultaneously via the LSL stream. |
Create Custom Application |
Allows users to develop and integrate their own applications with the system. |
Software Requirements#
Arduino IDE – Required to upload the Chords Arduino firmware to your development board.
Python – Ensure you have the most recent version installed.
VS Code or any other code editor (Alternatively, you can use the Command Prompt).
Hardware Requirements#
To use Chords-Python, you need:
A development board (Compatible Boards)
A USB cable (type depends on the board)
BioAmp Hardware and its accessories
Setting up the hardware#
Make all the connections according to the hardware you are using , including sensor connections with the development board, body connections with the sensor, and connections from the development board to your laptop.
Uploading the code#
Once you are all set, it is time to upload the code to your development board. Go to Chords Arduino Firmware GitHub repo, scroll down to the supported boards table, find your board name, and click on the Arduino sketch corresponding to that row. Copy the sketch and paste it into Arduino IDE. Go to tools, select your board, and the correct COM port. Now, hit the upload button.
Opening Chords-Python#
There are two ways to use Chords-Python:
A. Using the `chordspy` Python Package (Recommended)
B. Running Scripts Manually from the Repository
A. Using the chordspy Package#
This is the smoothest way to get started. Follow the steps below:
Install Python Make sure latest version of Python is installed.
Create and Activate a Virtual Environment:
On Windows:
python -m venv .venv.venv\Scripts\activateOn macOS/Linux:
python3 -m venv .venvsource .venv/bin/activate
Install the Package:
pip install chordspyLaunch the Web Interface:
chordspy
A web interface will open where you can connect your device and access applications.
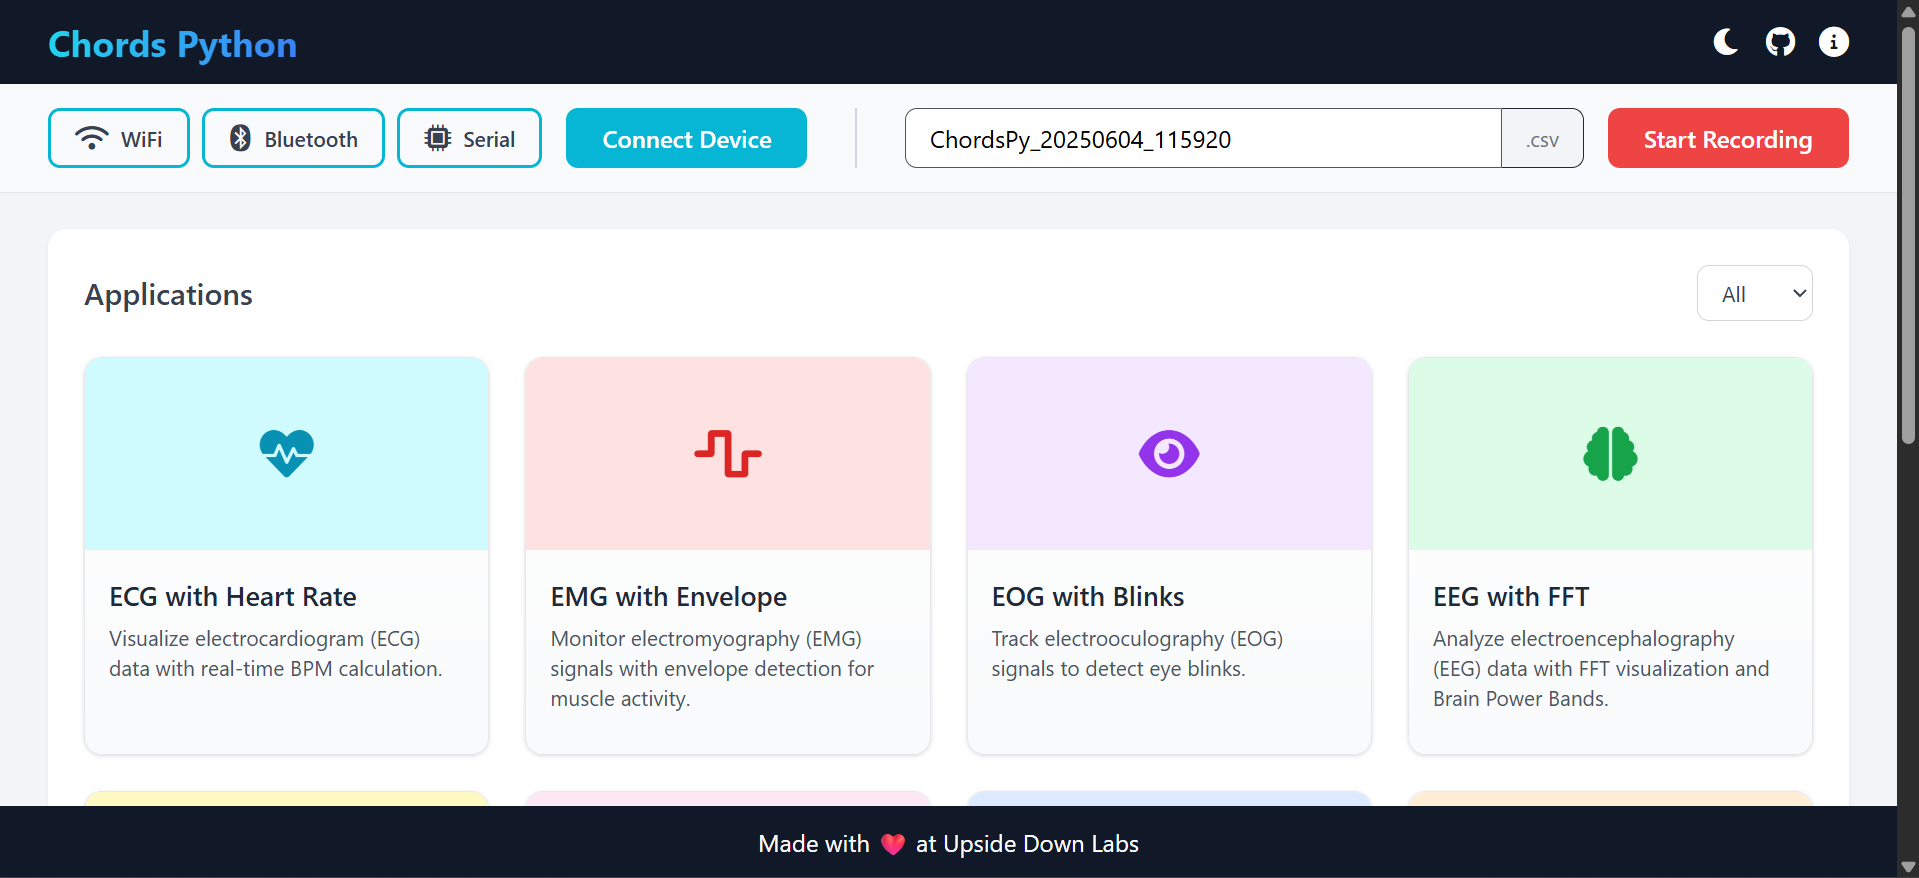
Interface in Light Mode#
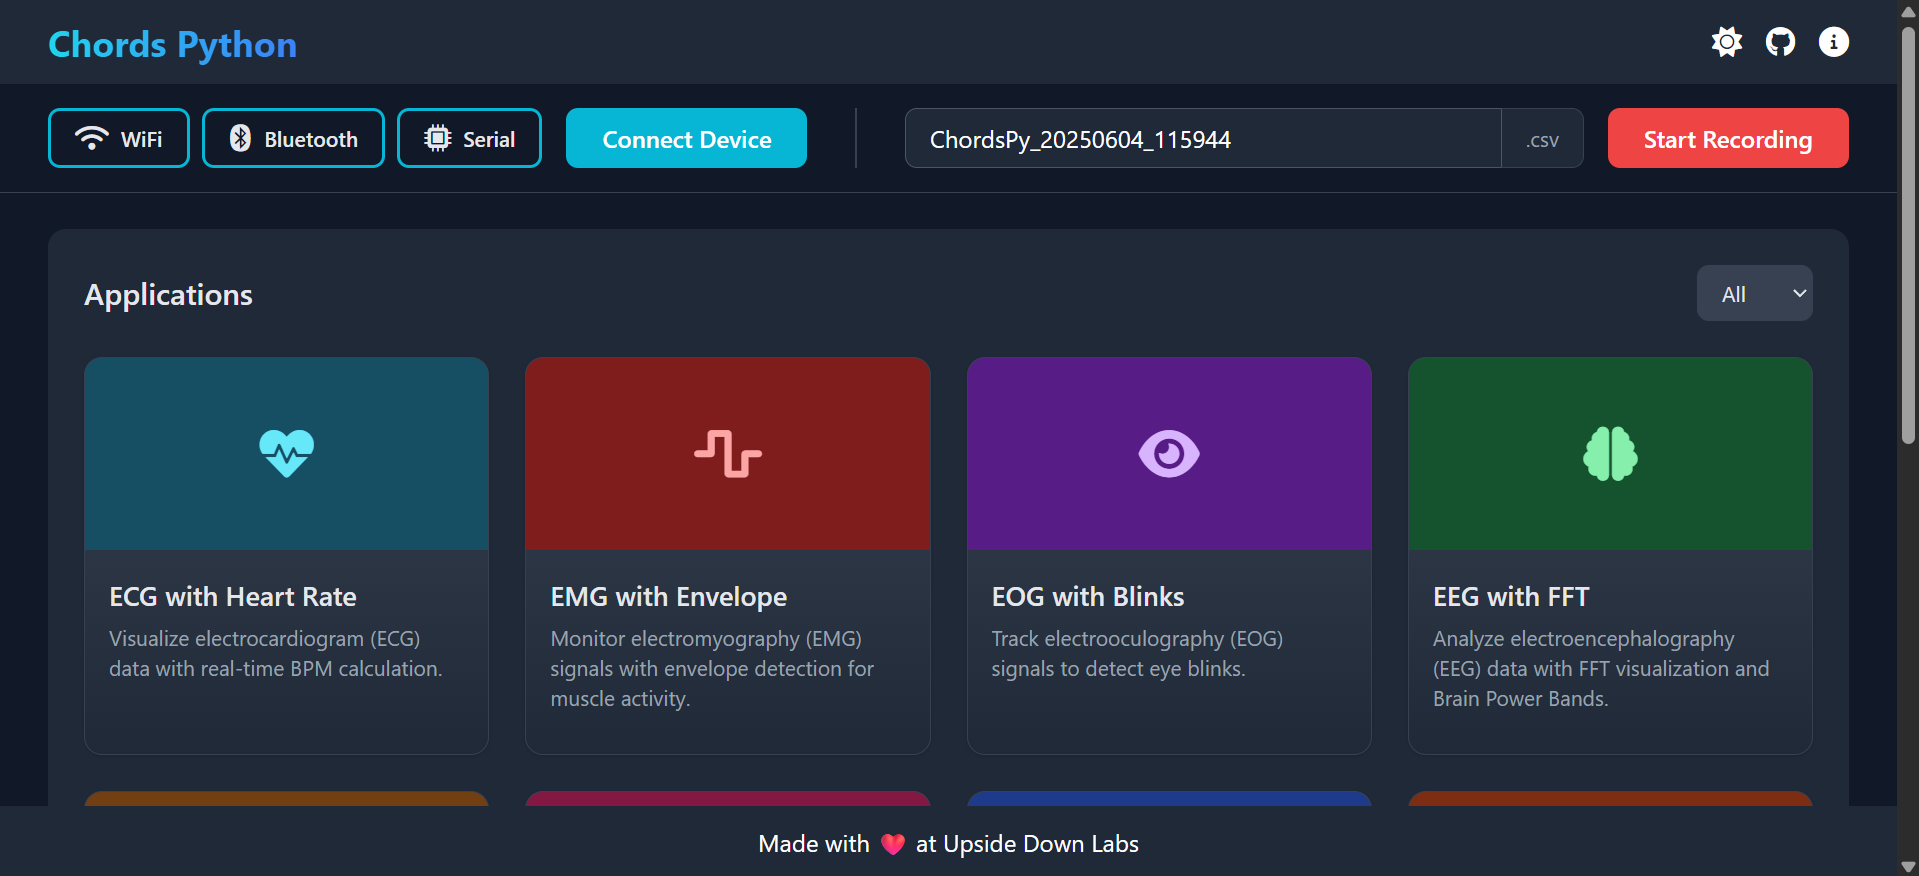
Interface in Dark Mode#
B. Running Scripts Manually (Alternative)#
If you prefer running scripts directly (for development, debugging, or customization):
Download the Repository:
You can download the Chords-Python repository from GitHub by visiting the following link: Chords-Python.
Or, you can clone the repository using Git by running the following command:
git clone https://github.com/upsidedownlabs/Chords-Python.gitCreate and Activate a Virtual Environment (if not already):
On Windows:
python -m venv .venv.venv\Scripts\activateOn macOS/Linux:
python3 -m venv .venvsource .venv/bin/activate
Install Requirements:
pip install -r requirements.txtRun the Application:
Navigate to the chordspy folder and run:
python -m chordspy.app                          # To launch the web interface
python -m chordspy.connection --protocol usb    # To start LSL stream via USB
python -m chordspy.connection --protocol ble    # To start LSL stream via BLE
python -m chordspy.connection --protocol wifi   # To start LSL stream via WiFi
To run any application, open a new terminal:
python chordspy.gui.py         # GUI Application
python chordspy.ffteeg.py      # EEG with FFT Analysis
Connection#
The first step is to establish a connection with your device and start the stream.
There are three connection options available:
Wi-Fi
Bluetooth
Serial (USB)
Wi-Fi#
Upload the Wi-Fi firmware through the
Chords-Arduino-FirmwarerepositoryTurn on the device and connect to the access point created by the device (e.g.,
npg-lite-2)In the web interface:
Click the Wi-Fi button
Click the Connect button
A pop-up notification will appear indicating a successful connection.
Bluetooth#
Upload the Bluetooth firmware through the
Chords-Arduino-FirmwarerepositoryTurn on the device and enable Bluetooth on your computer
In the web interface:
Click the Bluetooth button
Select your device from the list of available devices
Hit the Connect button
A pop-up notification will appear indicating a successful connection.
Serial (USB)#
Upload the Serial firmware through the
Chords-Arduino-FirmwarerepositoryConnect the device to your computer using a USB cable
In the web interface:
Click the Serial button
Click the Connect button
A pop-up notification will appear indicating a successful connection.
Note
The connection step is essential as it initiates the LSL Stream, which is required for running applications.
CSV Logging#
The raw data received from the device can be logged to a CSV file for further analysis or record-keeping. This optional feature can be enabled or disabled in the web interface.
To use CSV logging:
Click the Start recording button to begin logging - A file with name is created
ChordsPy_{timestamp}.csvin the same folder. - File includes columns for counter and channel dataClick the Stop recording button to end logging - File will be saved in the same folder

CSV Logging#
Applications#
There are many applications available that stream the LSL and can be run for various purposes.
List of available applications:
1. ECG with Heart Rate#
Overview#
The ECG with Heart Rate is a real-time application designed to visualize and analyze Electrocardiogram (ECG) data using the Lab Streaming Layer (LSL) protocol. Built with Python and PyQt5, this application provides a graphical interface for monitoring ECG signals, detecting R-peaks (heartbeats), and calculating the heart rate in real time. It applies signal processing techniques and utilizes the neurokit2 library to estimate R-peak detection and heart rate.
Features#
Features |
Description |
|---|---|
|
|
|
|
|
|
|
|
|
|
A GUI window will appear, displaying the real-time ECG signal along with the calculated heart rate.
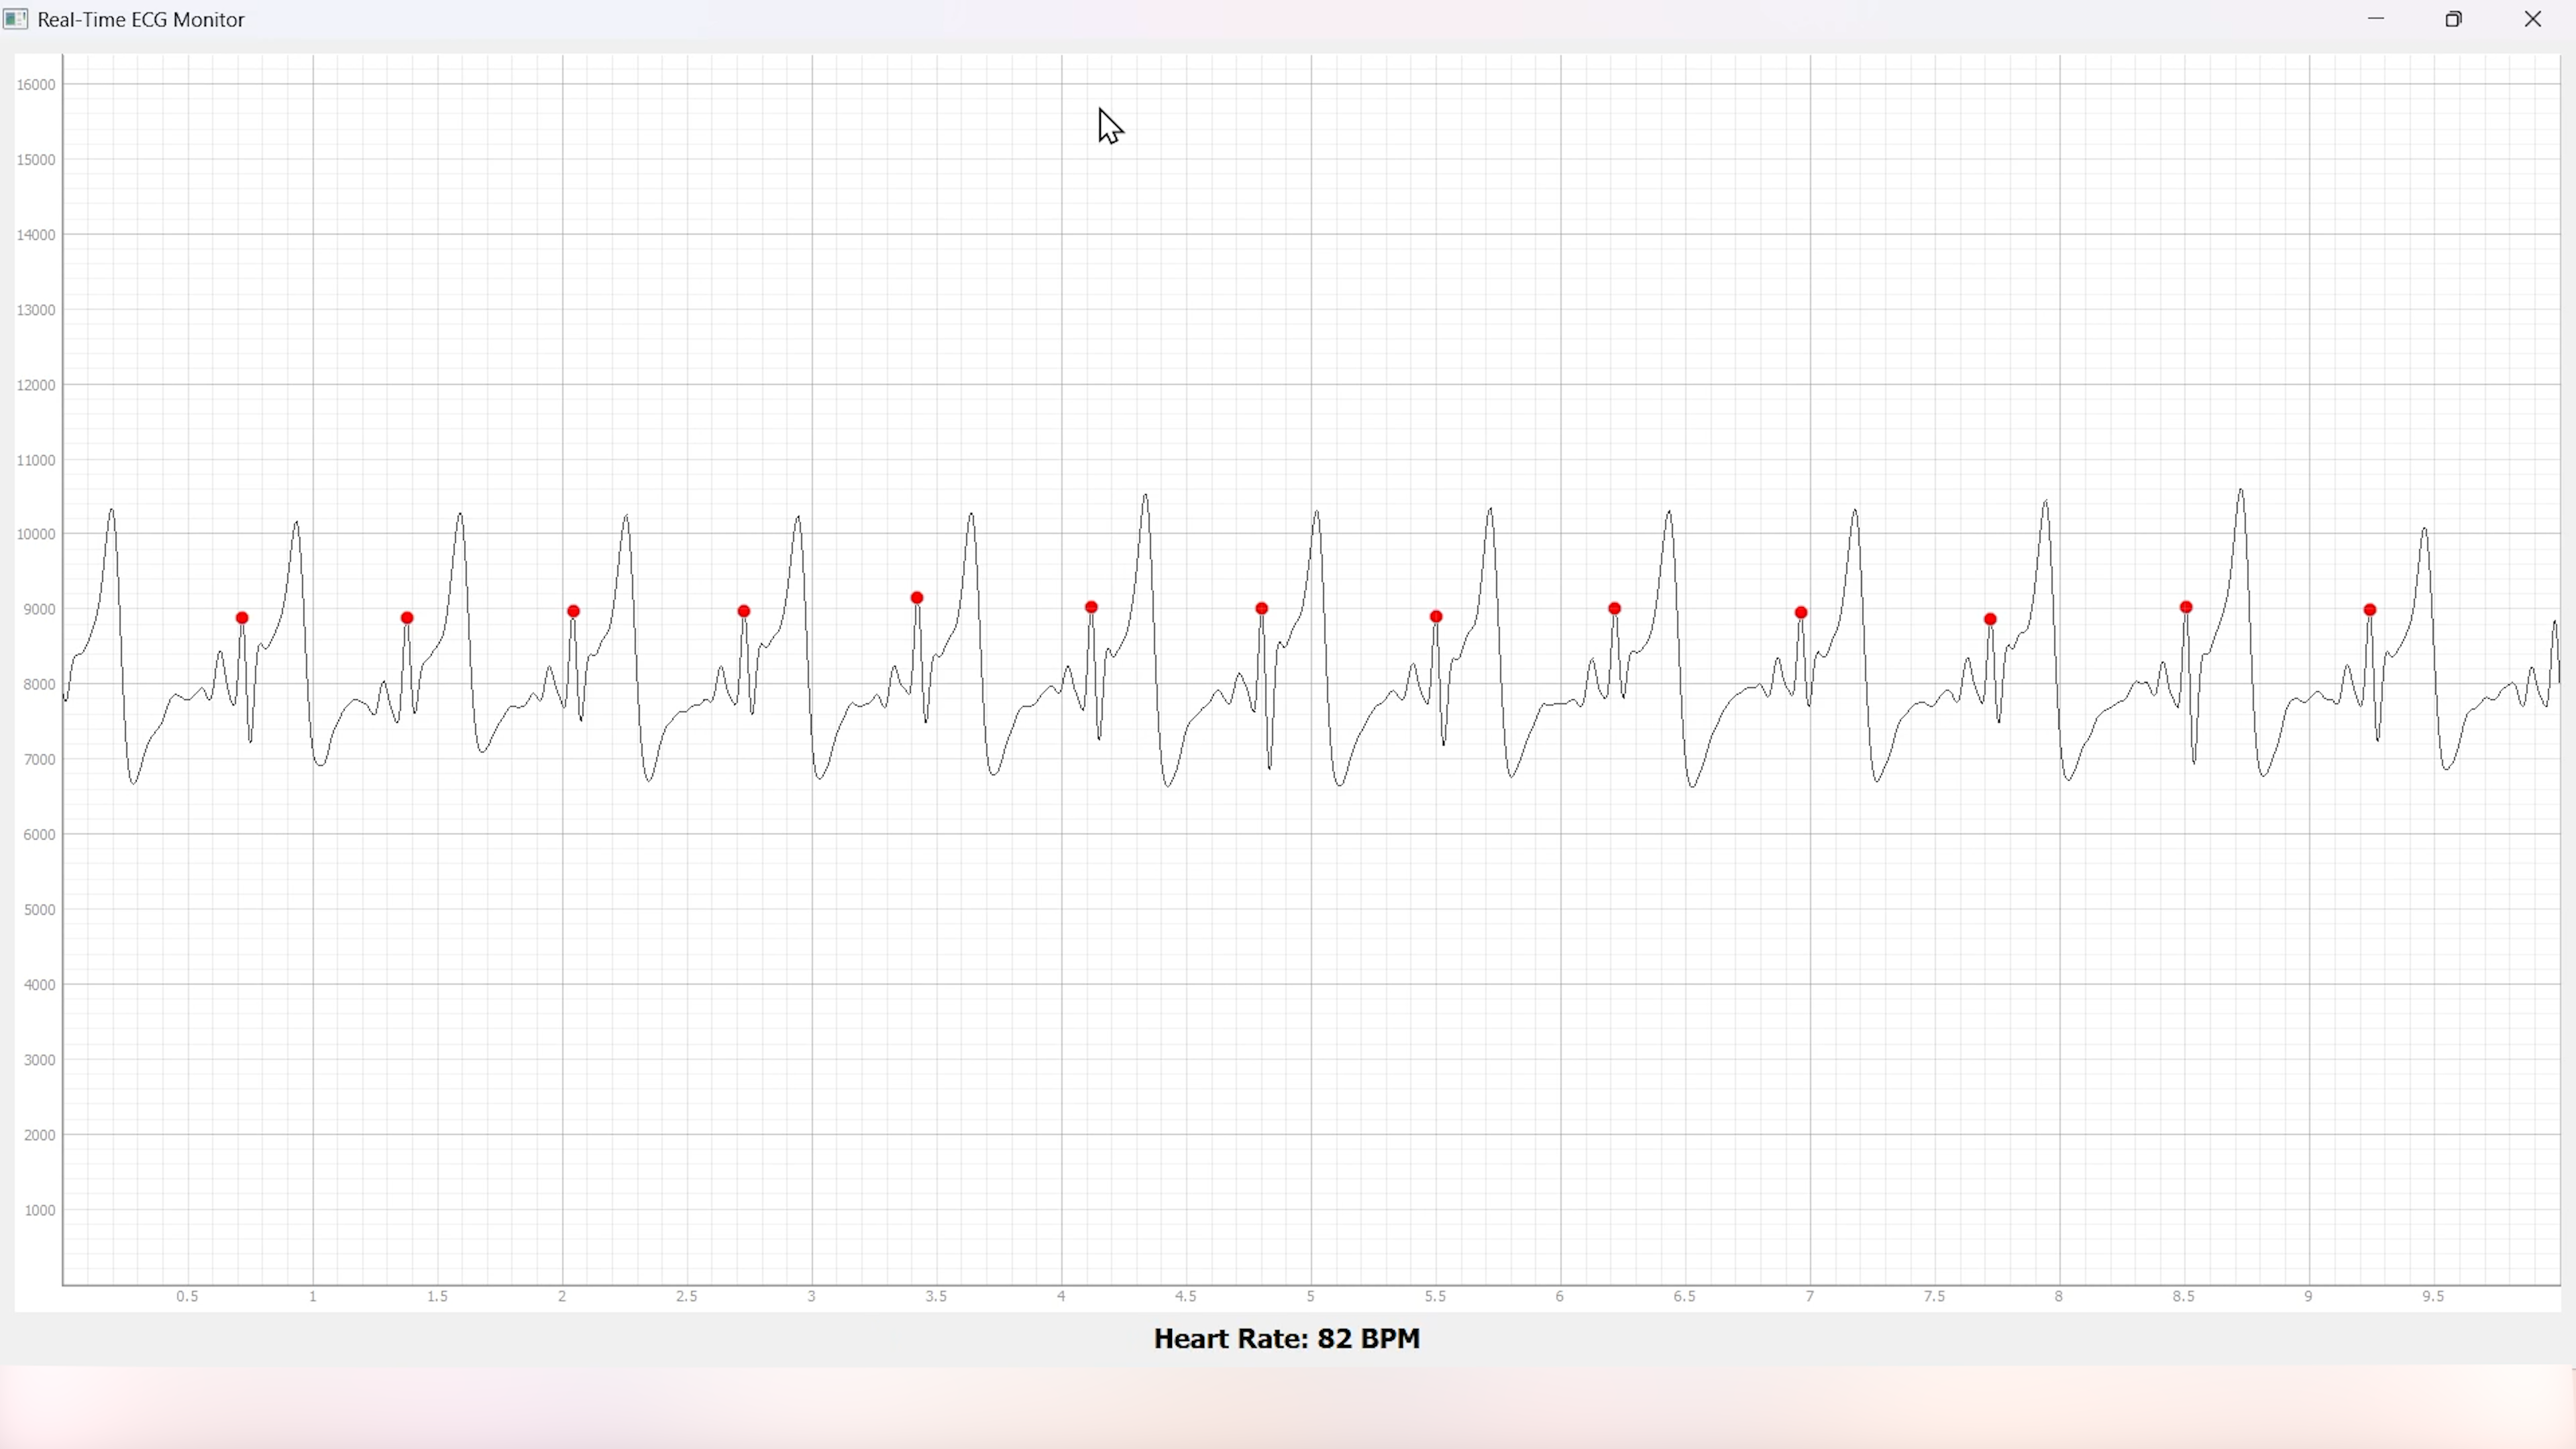
Heart Rate with ECG#
2. EMG with Envelope#
Overview#
The EMG with Envelope is a Python-based application designed to visualize and analyze Electromyography (EMG) signals in real-time. It connects to an EMG data stream using the Lab Streaming Layer (LSL) protocol, processes the signal to extract the EMG envelope, and displays both the filtered EMG signal and its envelope in a user-friendly graphical interface. Built with PyQt5 and pyqtgraph, the application provides a responsive and interactive visualization tool for students, researchers, or developers working with EMG data.
Features#
Features |
Description |
|---|---|
|
|
|
|
|
|
|
|
|
|
A GUI window will appear, displaying the real-time EMG signal along with the calculated EMG Envelope.
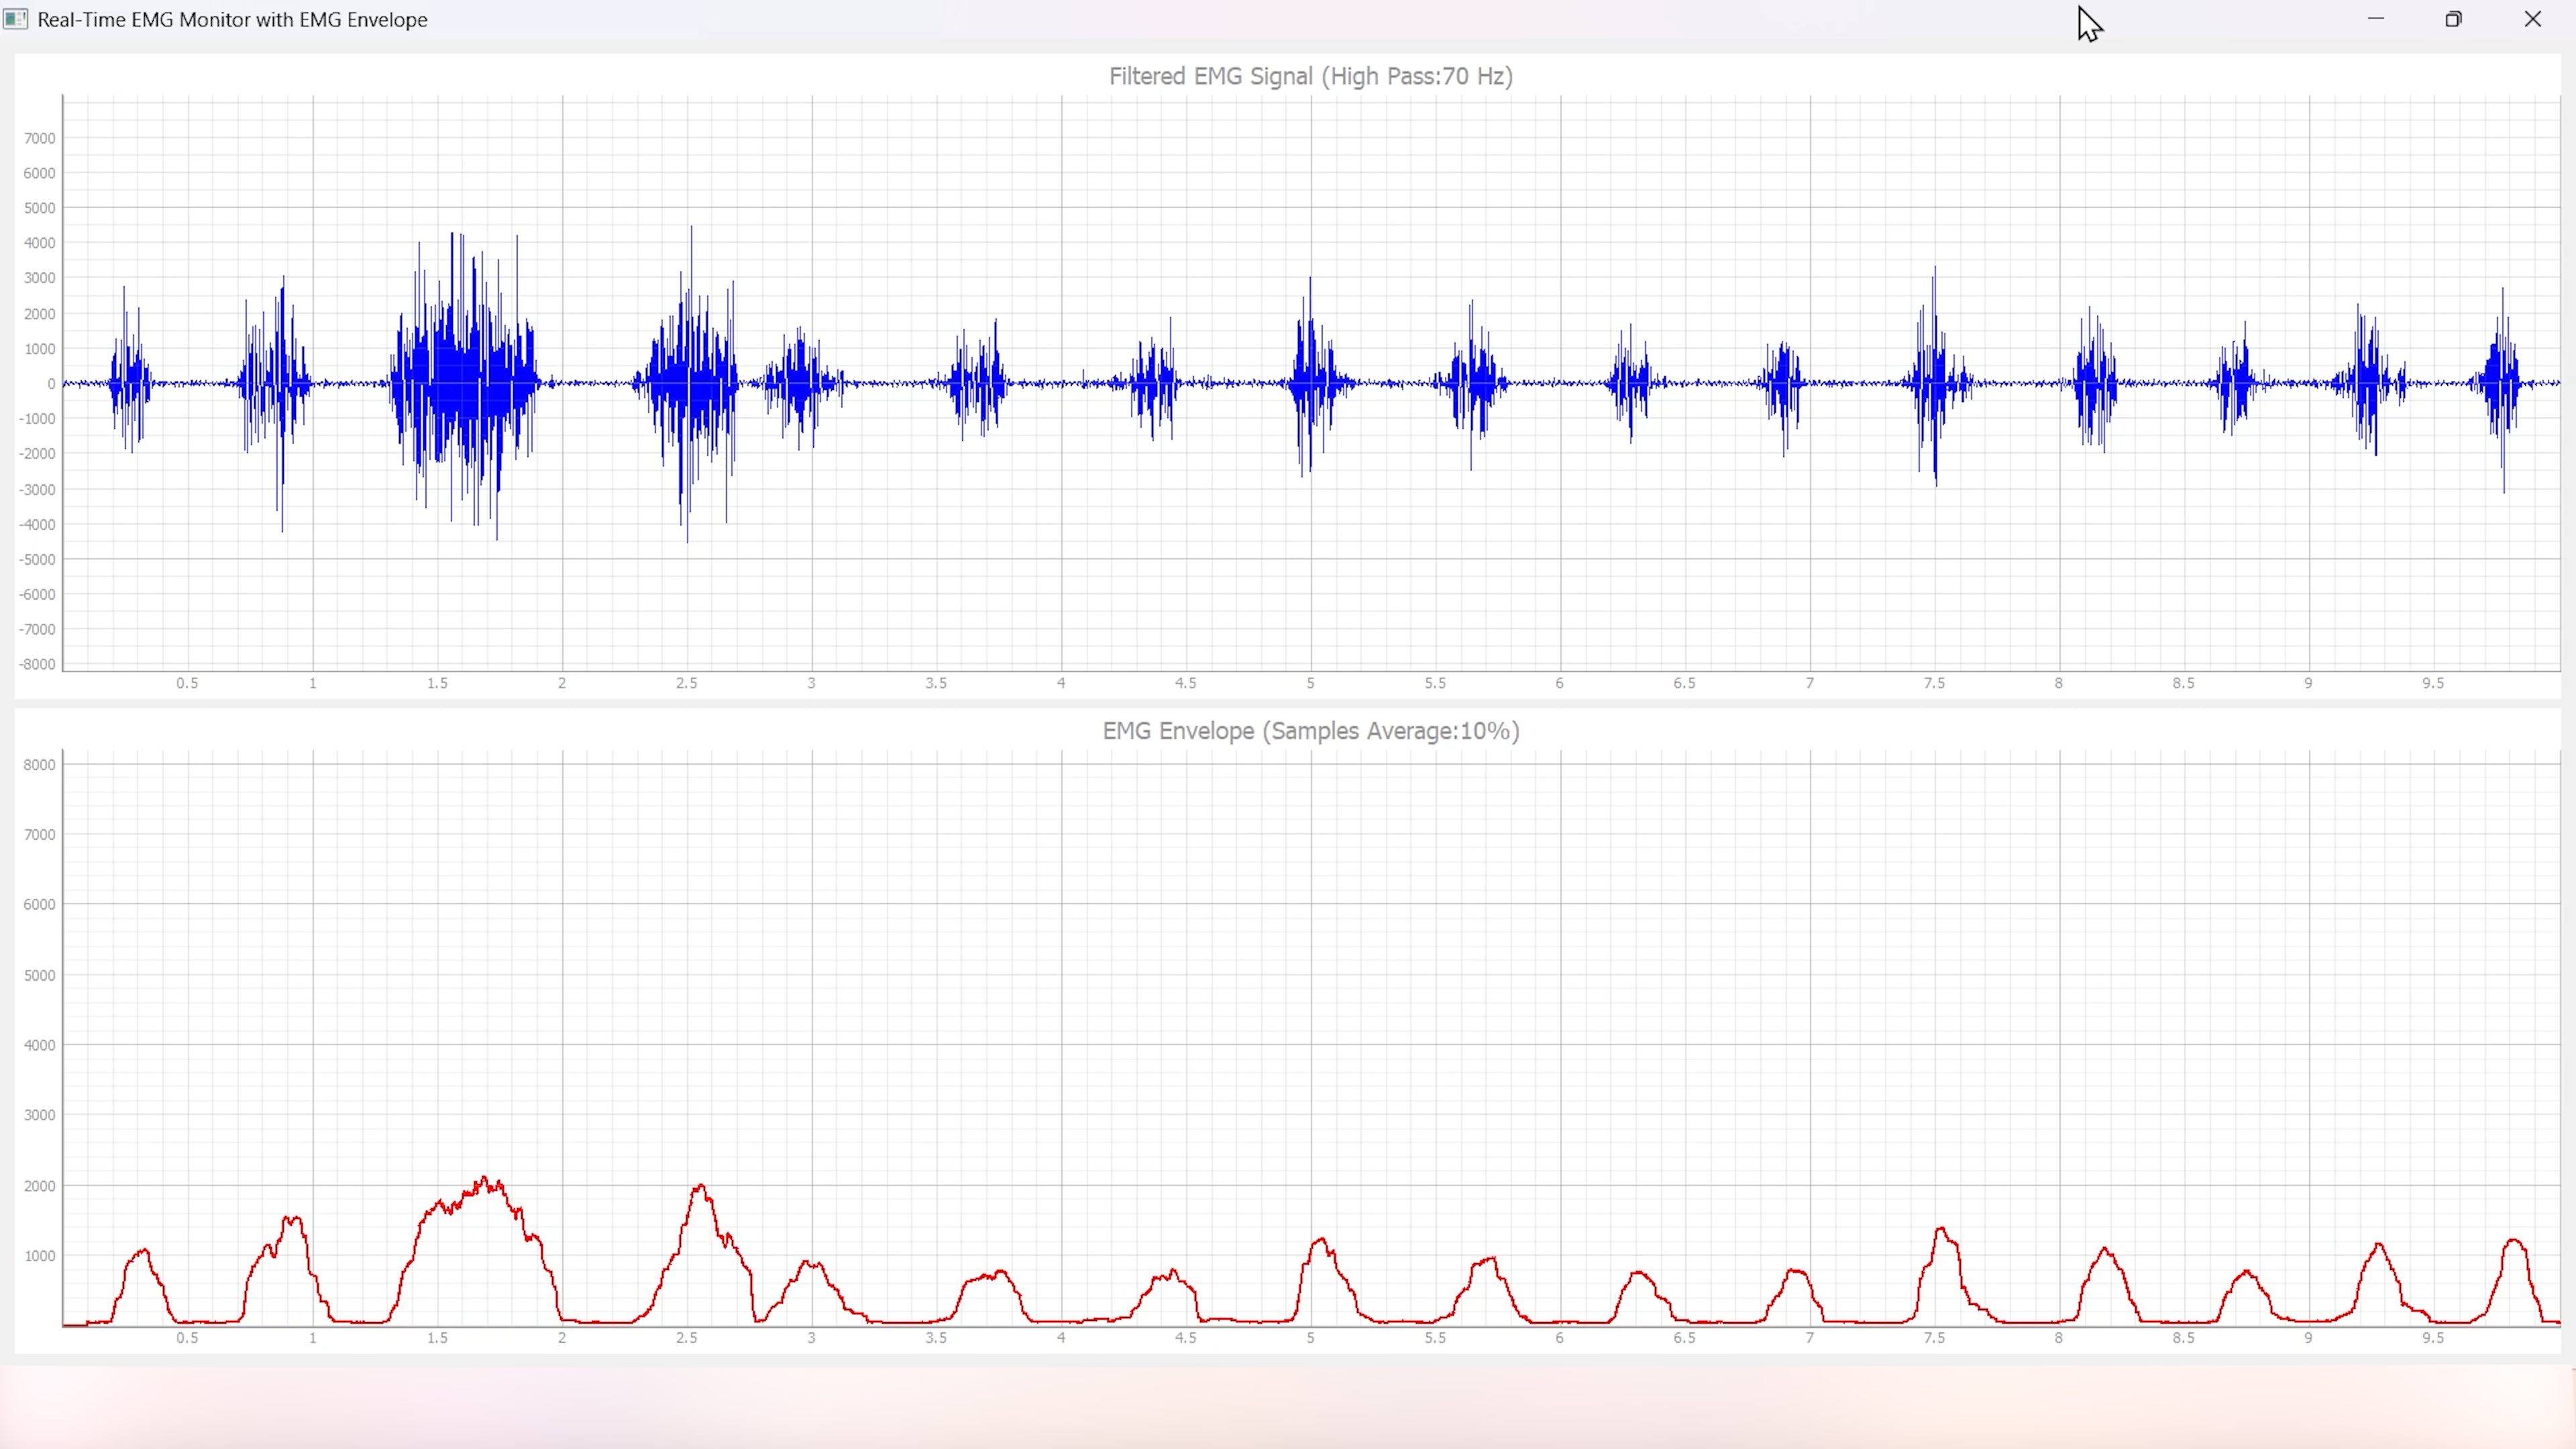
EMG with Envelope#
3. EOG with Blinks#
The EOG with Blinks is a Python-based application designed to visualize and detect eye blinks in real-time using Electrooculography (EOG) signals. Built with the PyQt5 framework and PyQtGraph for plotting, the application connects to an LSL (Lab Streaming Layer) stream to acquire EOG data, processes the signal using a low-pass filter, and detects blinks based on dynamic thresholds. The application provides a dual-plot interface to display the filtered EOG signal and detected blinks, making it a useful tool for real-time monitoring and analysis of EOG data.
Features#
Features |
Description |
|---|---|
|
|
|
|
|
|
|
|
A GUI window will appear, displaying the real-time EOG signal along with the Blinks marked as Red dot.
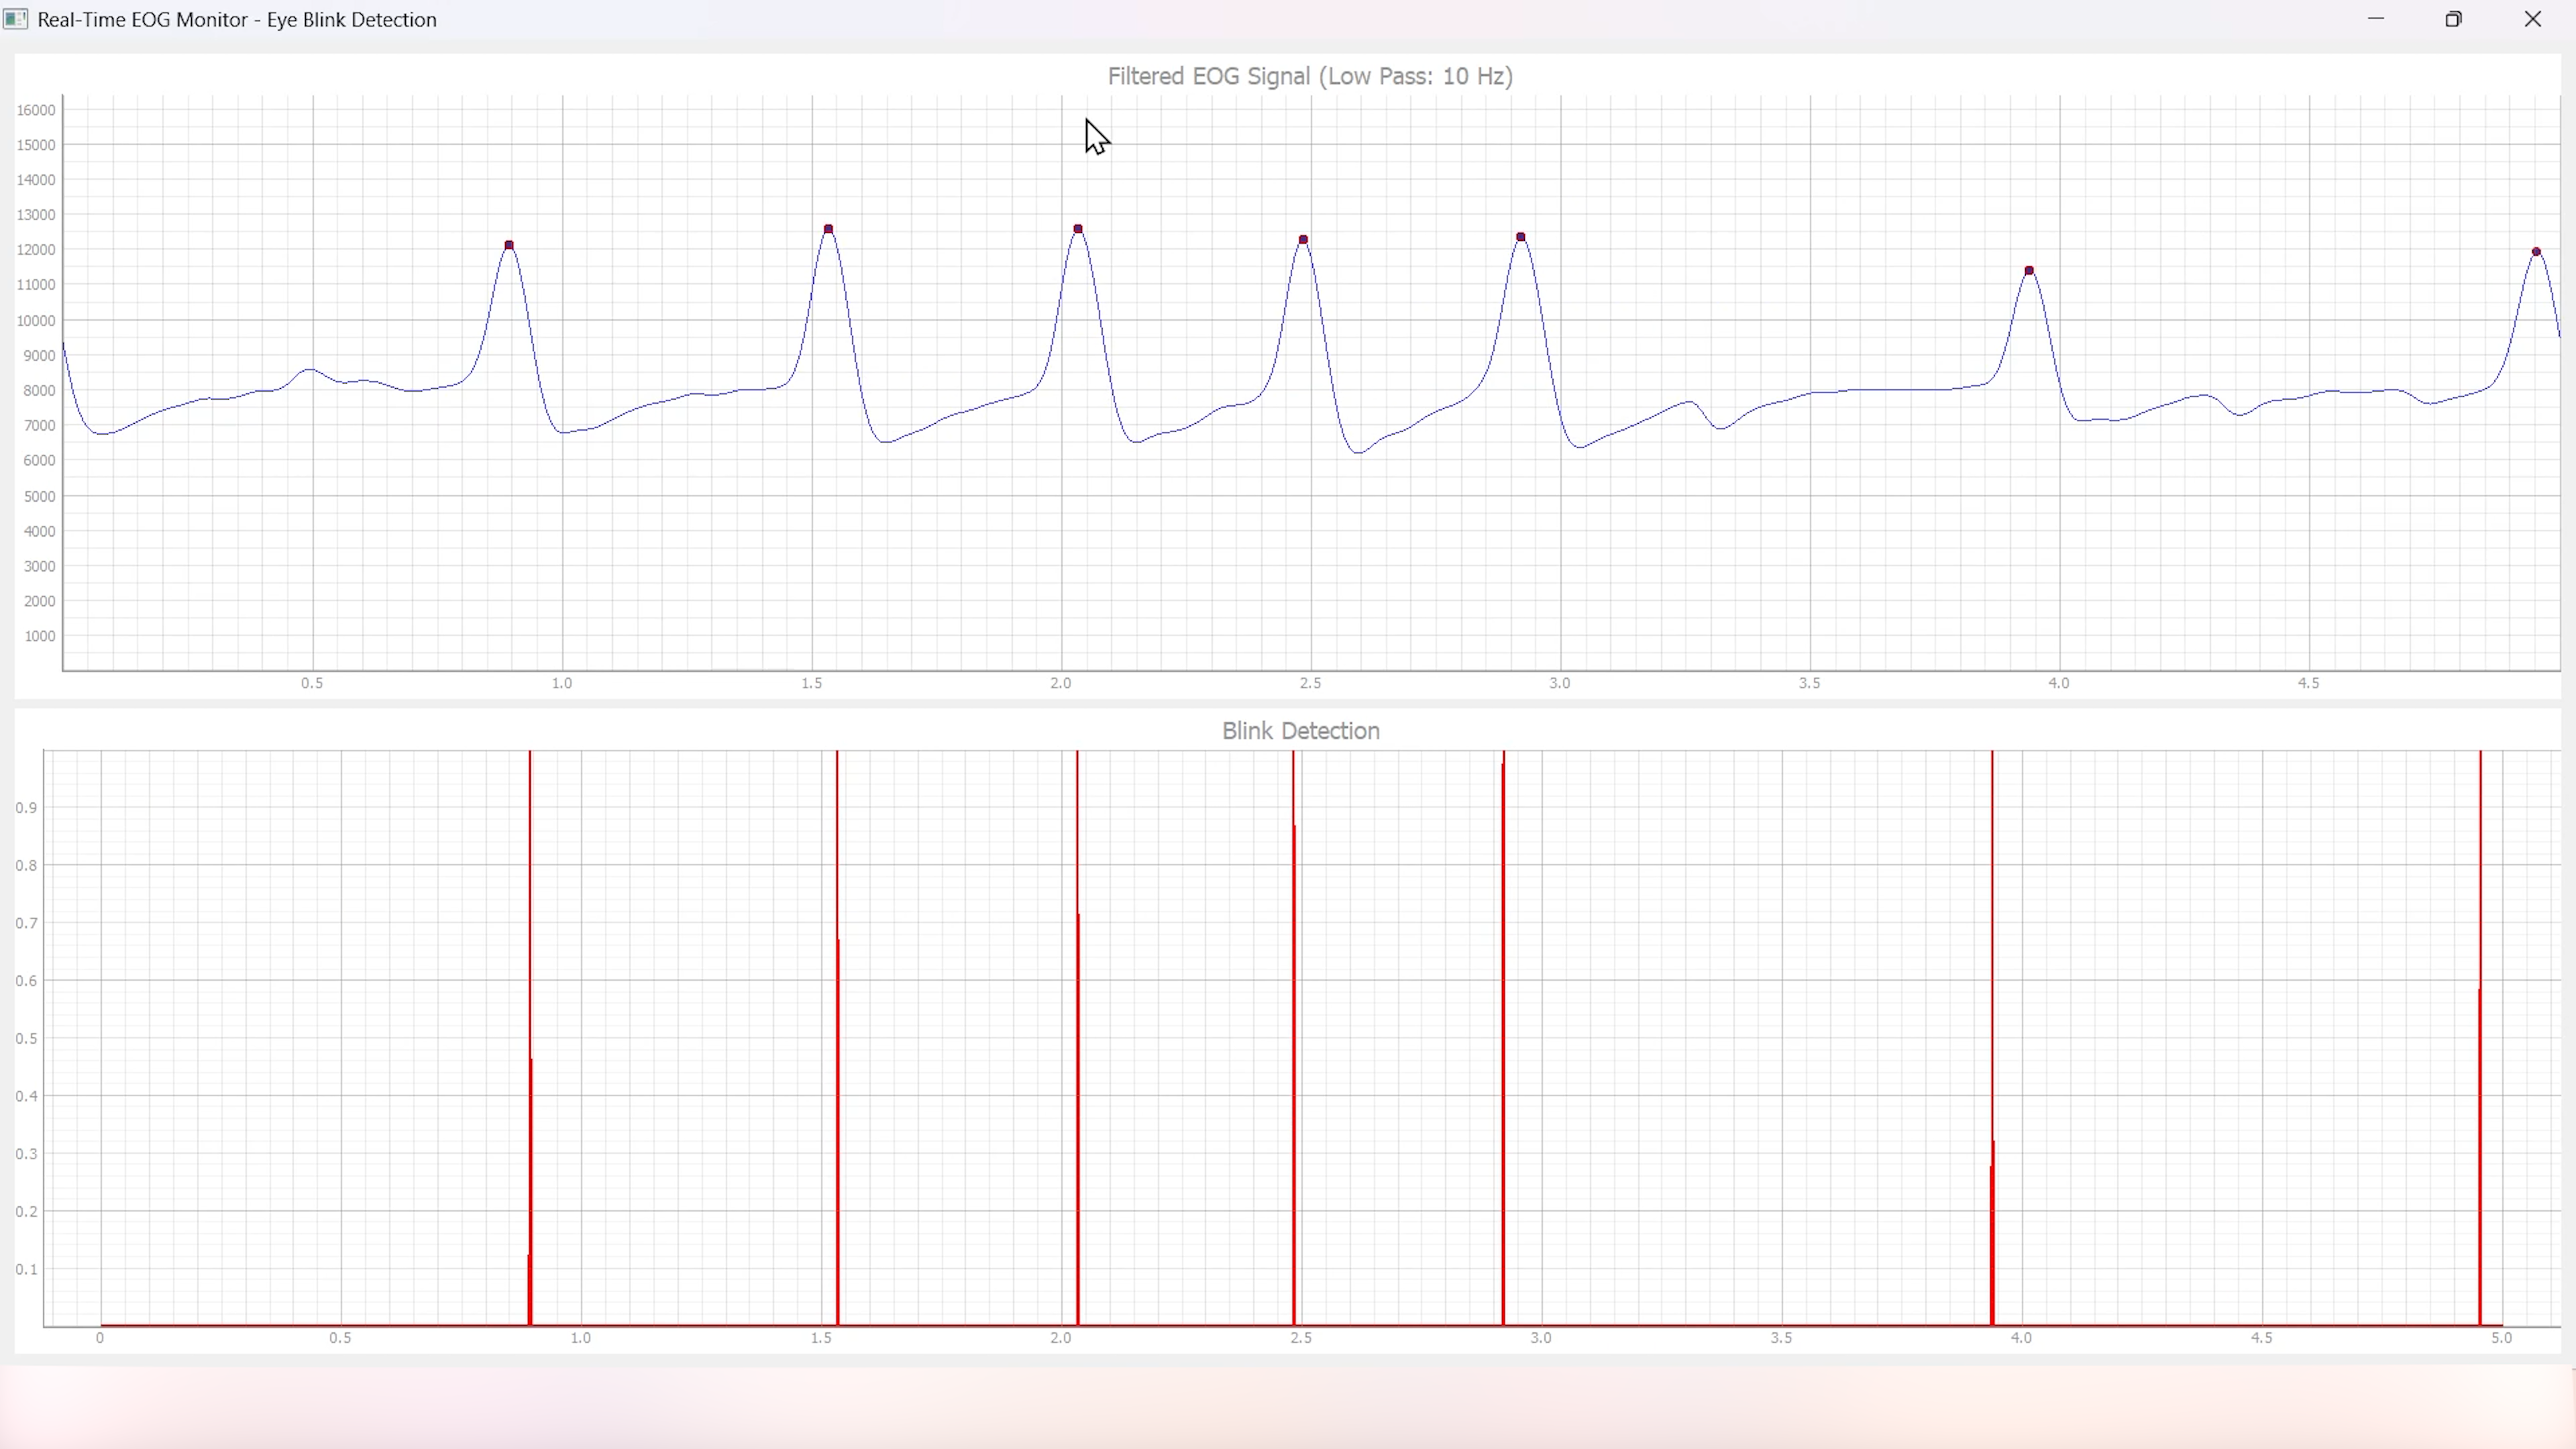
EOG with Blinks#
4. EEG with FFT#
Overview#
The EEG with FFT and Brainwave Power is a Python-based application designed to visualize and analyze Electroencephalography (EEG) signals in real-time. It connects to an EEG data stream using the Lab Streaming Layer (LSL) protocol, processes the signal to remove noise, and performs Fast Fourier Transform (FFT) to compute the power of different brainwave frequency bands (Delta, Theta, Alpha, Beta, and Gamma). The application provides a graphical user interface (GUI) built with PyQt5 and pyqtgraph for real-time visualization of raw EEG signals, FFT results, and brainwave power distribution.
Features#
Features |
Description |
|---|---|
|
|
|
|
|
|
|
|
|
|
A GUI window will appear, displaying the real-time EEG signal along with the calculated FFT and Brainwave power distribution.
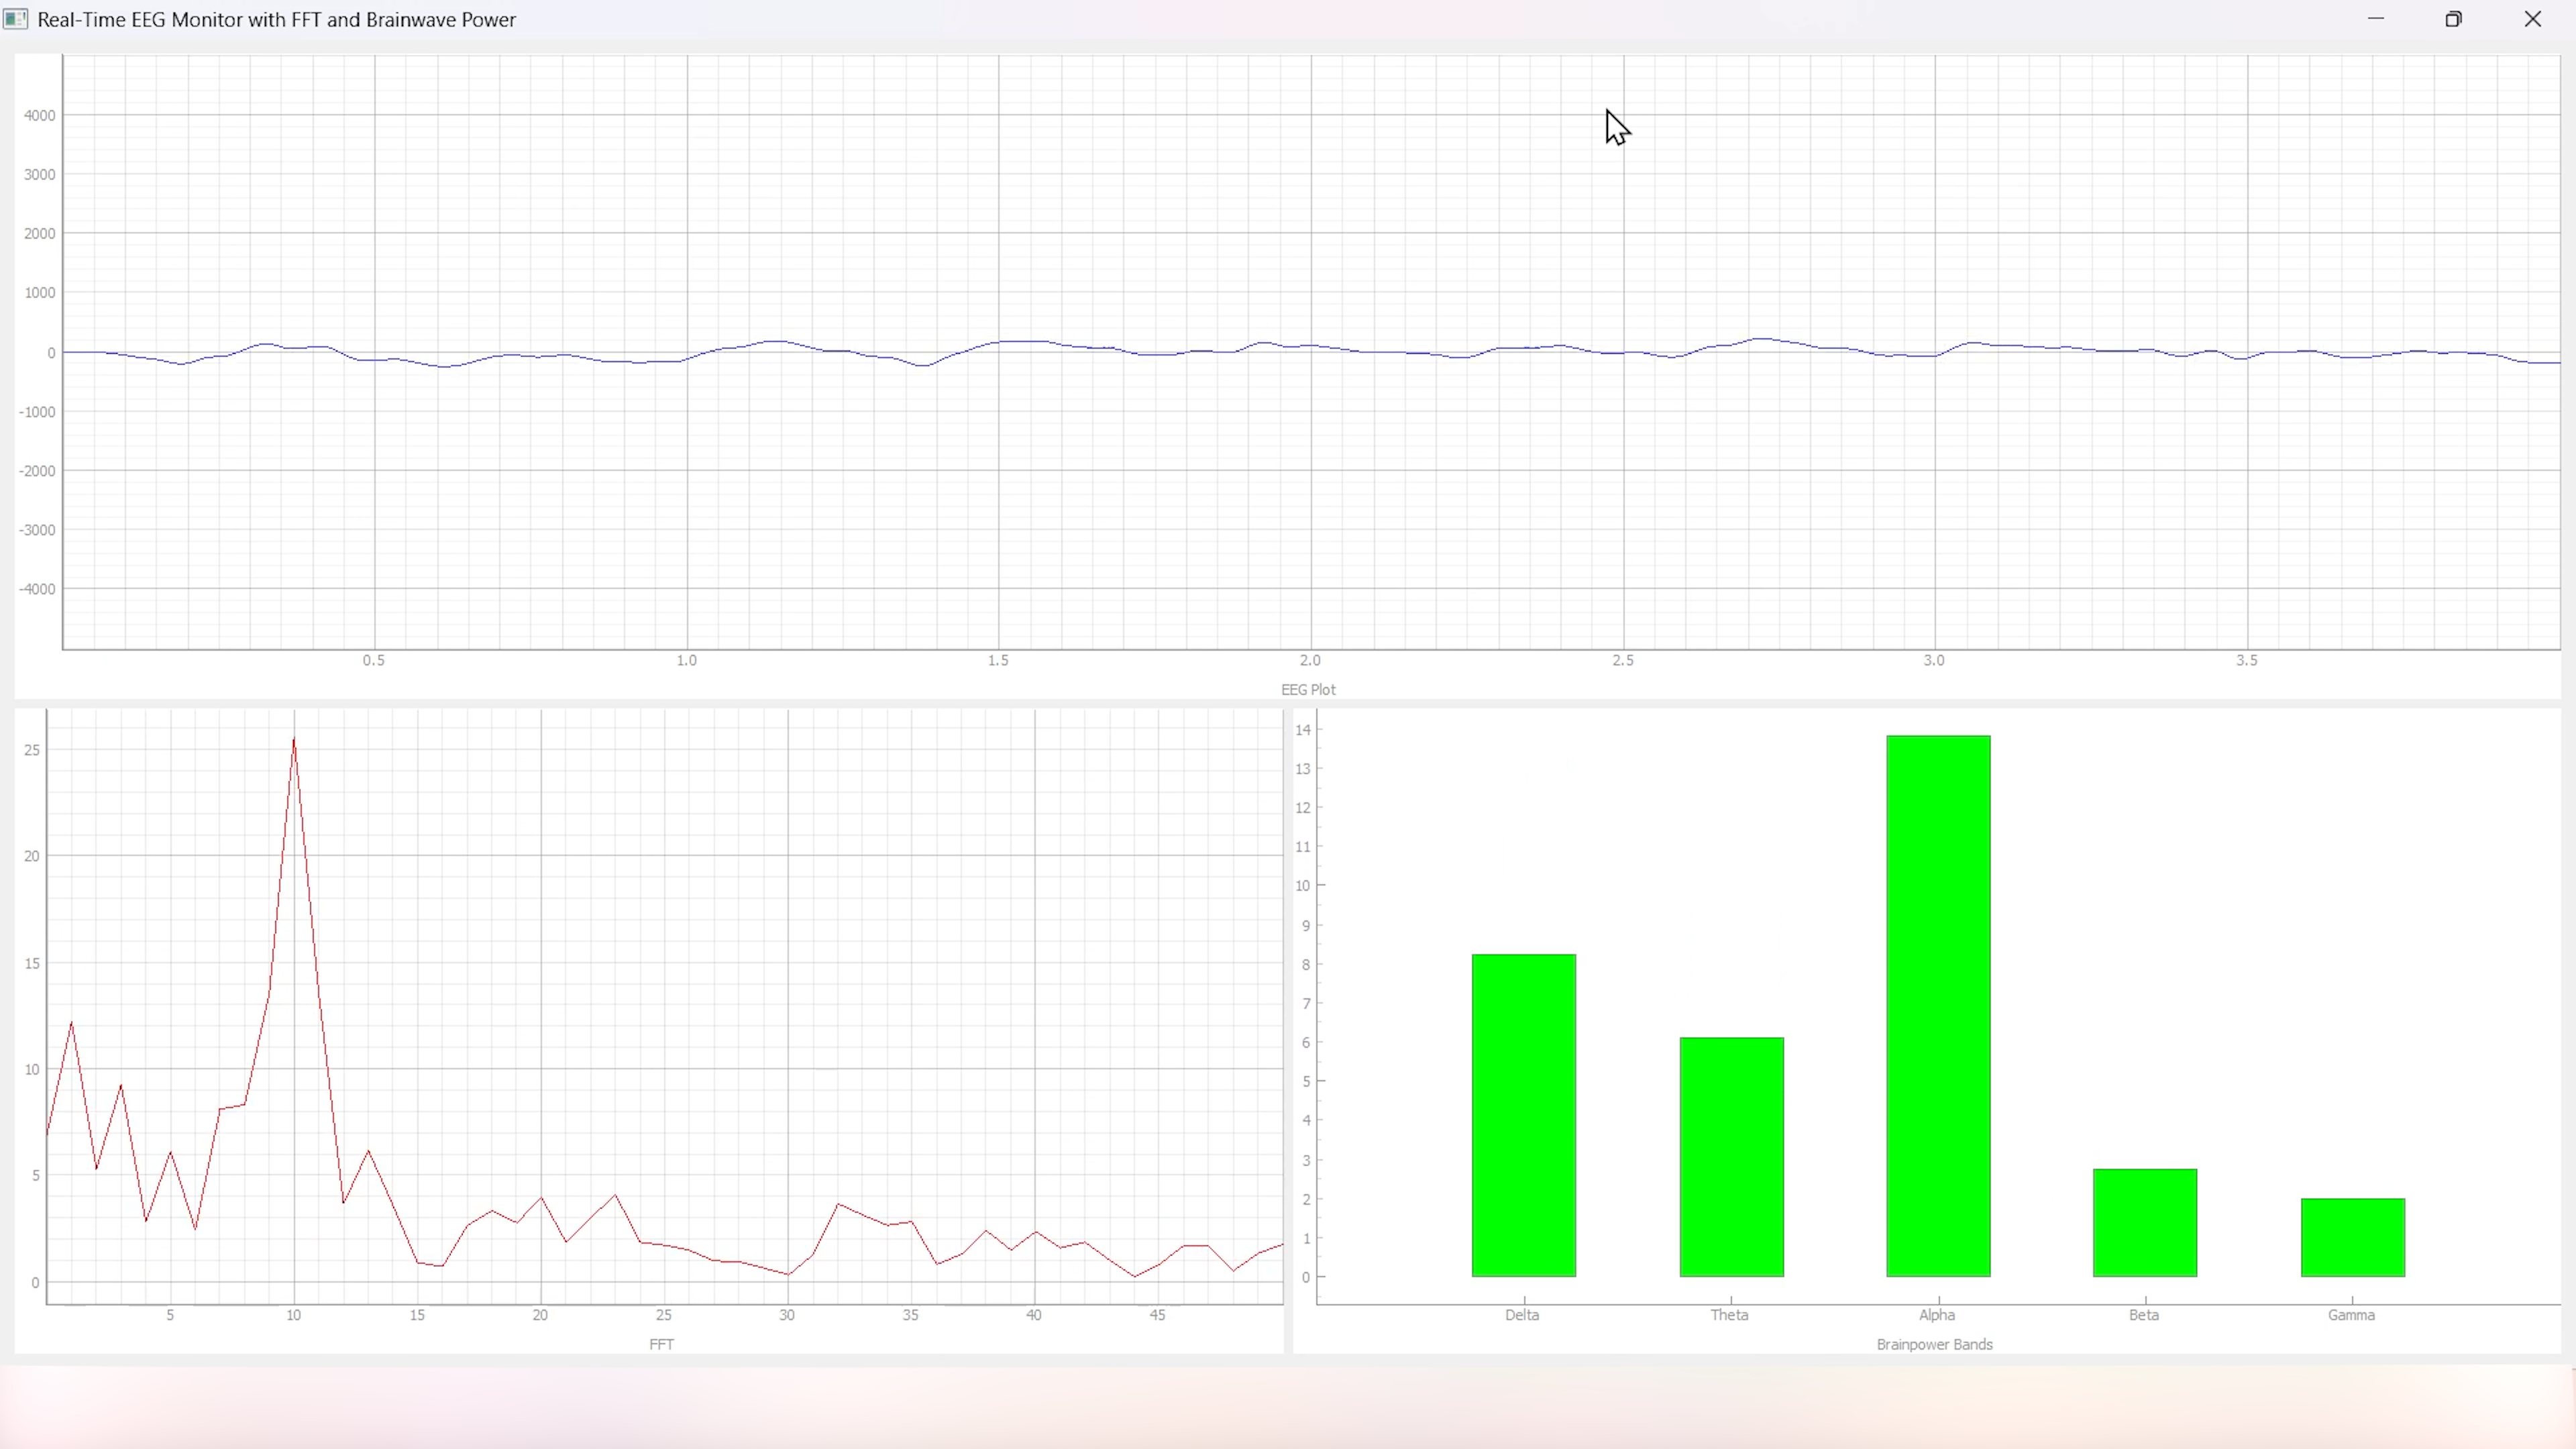
EEG with FFT#
Tip
To ensure you’re recording a high-quality signal, refer to the detailed guide here: Troubleshooting EEG Signal Quality.
5. EEG Tug of War Game#
Overview#
The EEG Tug of War Game is a Python-based application that leverages Electroencephalography (EEG) signals to create an interactive two-player game. Players control the movement of a ball on the screen by modulating their brain activity, specifically the Alpha and Beta frequency bands. The game uses the Lab Streaming Layer (LSL) protocol to acquire real-time EEG data, processes the signals to calculate relative power in the Alpha and Beta bands, and translates these into forces that move the ball. The first player aims to push the ball onto the opponent’s side to score and win the game. The application is built using the pygame library for the graphical interface and integrates with pylsl for EEG data acquisition.
Features#
Features |
Description |
|---|---|
|
|
|
|
|
|
|
|
|
|
The game window will open, featuring buttons for START/RESTART, PLAY/PAUSE, and EXIT. These buttons offer intuitive control, allowing players to easily start, pause, resume, or exit the game as needed.
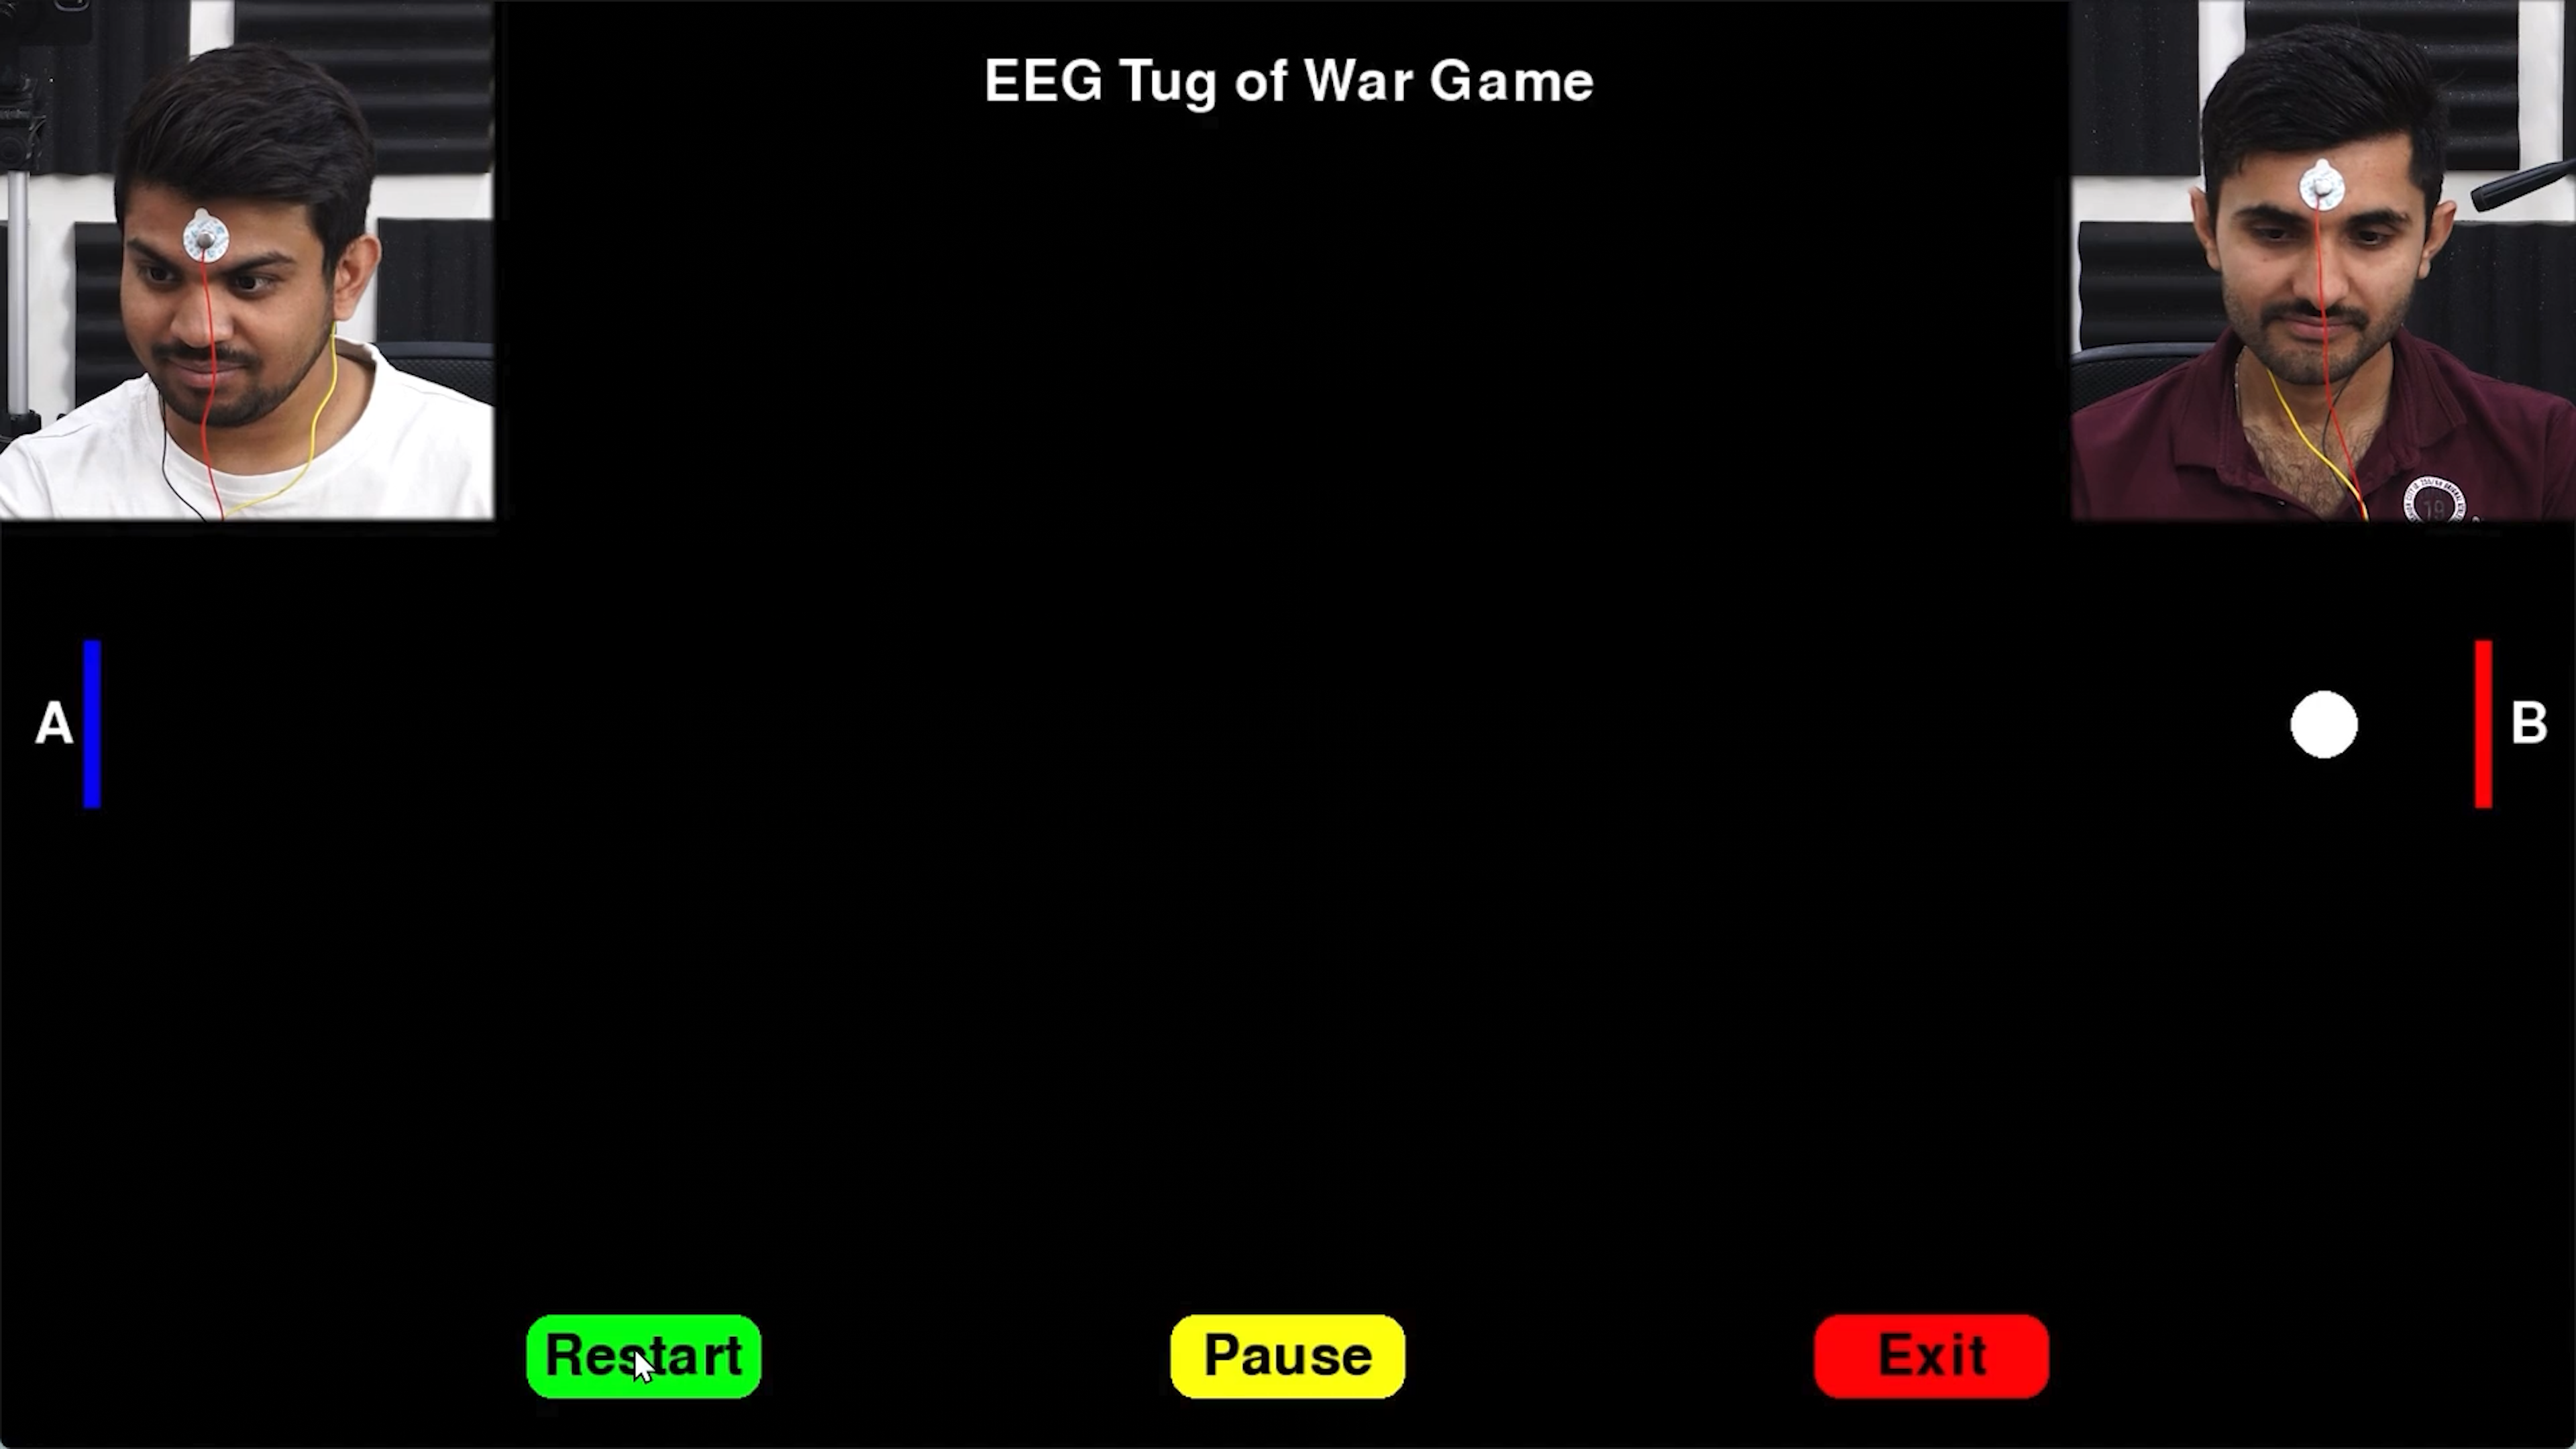
EEG Tug of War#
For detailed instructions, check out the EEG Tug of War Game Instructable.
6. EEG Beetle Game#
Overview#
The EEG Beetle Game is a Python-based application that uses Electroencephalography (EEG) signals to control a beetle’s movement in a 2D game environment. The game leverages the Lab Streaming Layer (LSL) protocol to acquire real-time EEG data, processes the signal to detect the user’s focus level, and translates it into upward or downward movement of the beetle. The application is built using the pygame library for the game interface and integrates signal processing techniques to analyze EEG data in real-time.
Features#
Features |
Description |
|---|---|
|
|
|
|
|
|
|
|
|
|
|
|
A GUI window will appear, showing all calibration messages, followed by the game starting, and finally displaying the game with the beetle.
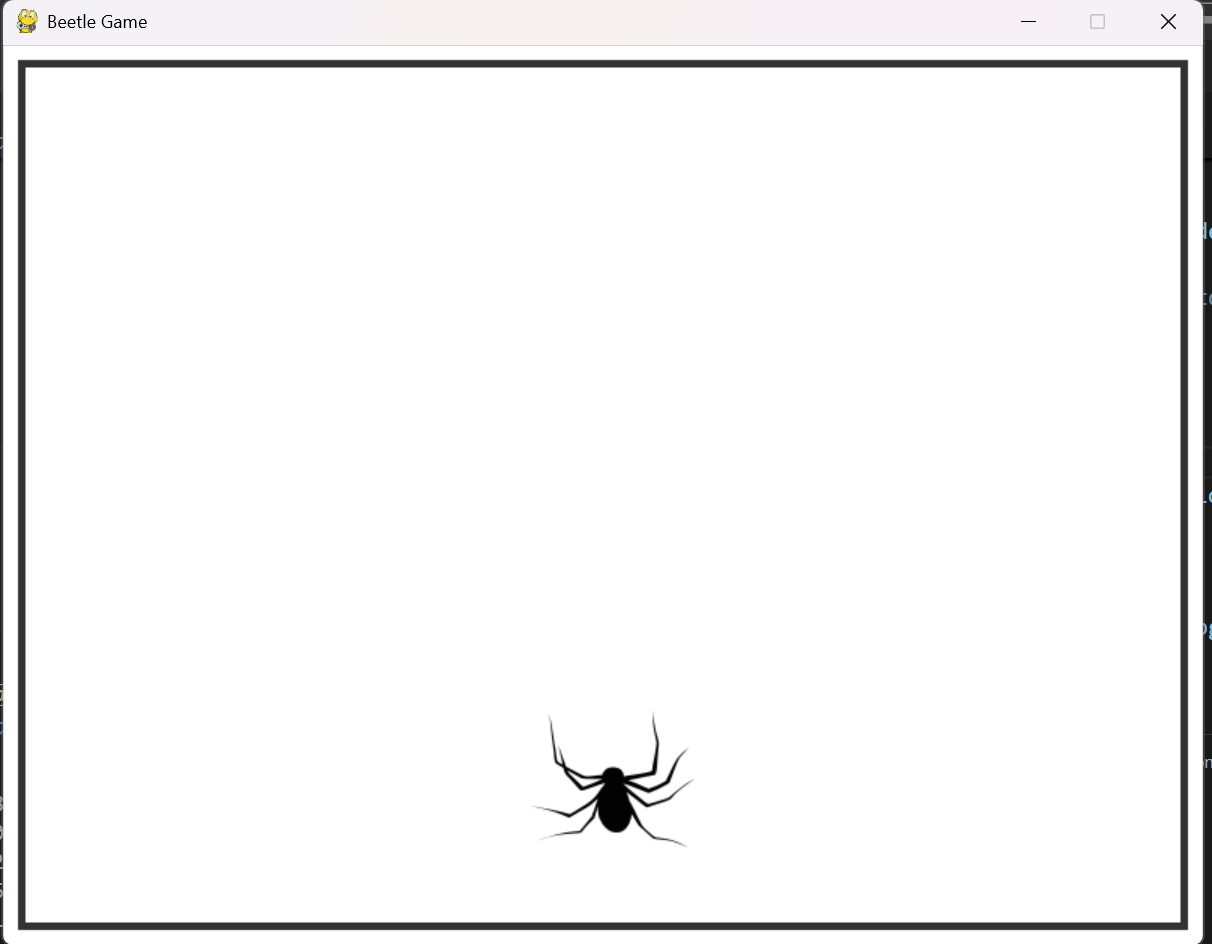
EEG Beetle Game#
7. GUI#
Overview#
The GUI application is a Python-based tool designed to visualize real-time data streams from an Arduino device using the Lab Streaming Layer (LSL) protocol. The application connects to an LSL stream, retrieves multi-channel data, and plots it in real-time using the pyqtgraph library.
Features#
Features |
Description |
|---|---|
|
|
|
|
|
|
A GUI window will appear that shows the data in real-time.
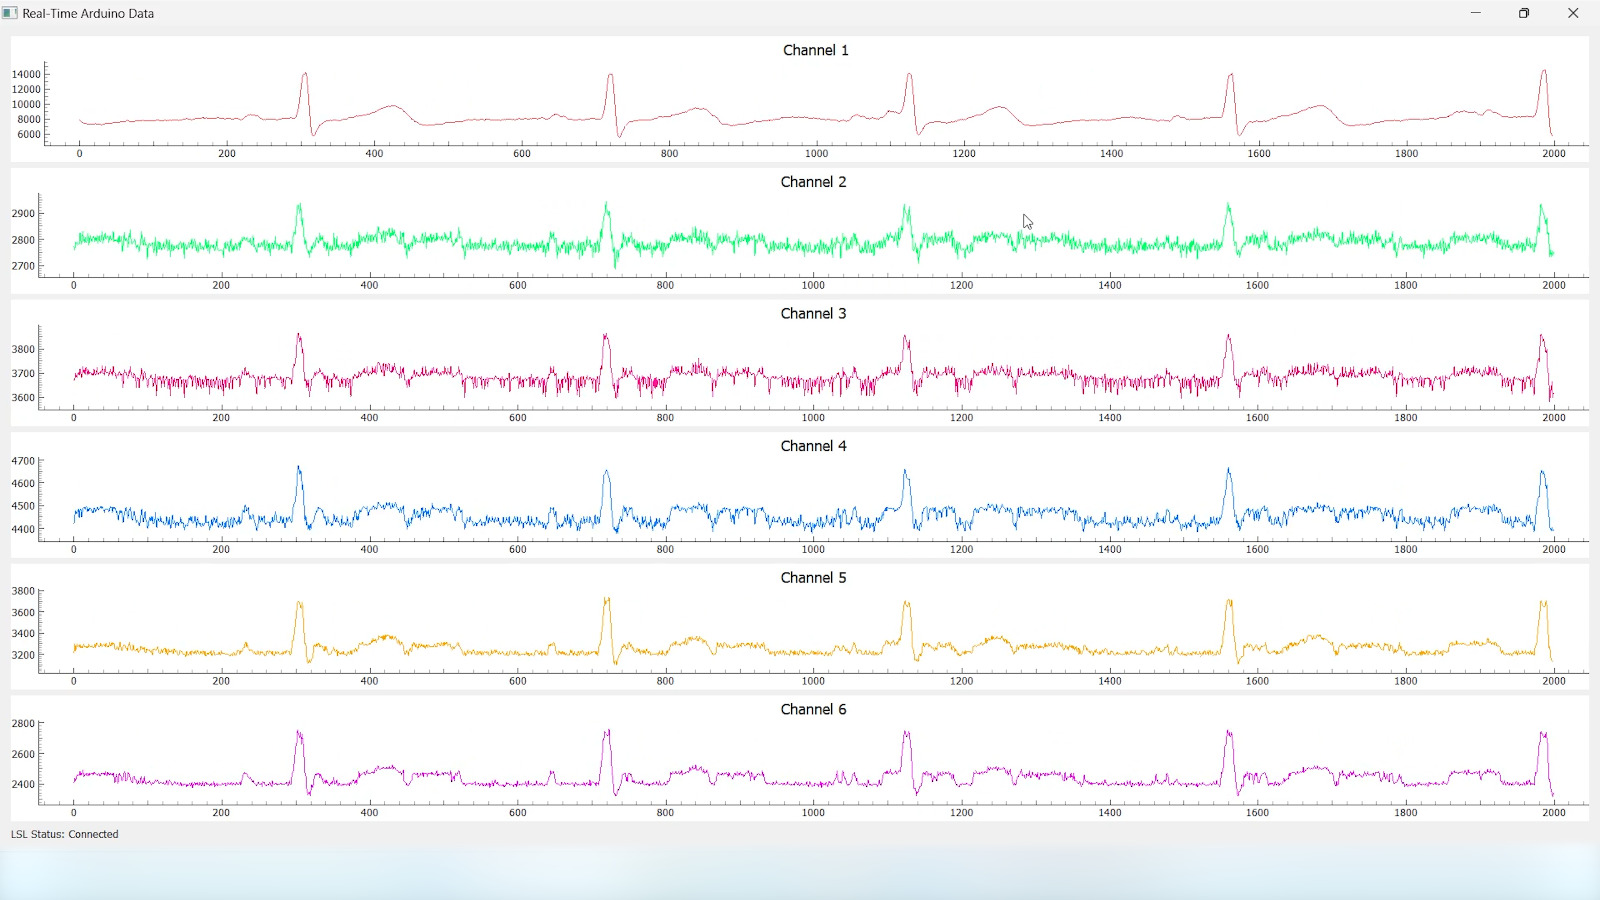
GUI#
8. EOG Keystroke Emulator#
Overview#
The EOG Keystroke Emulator is a Python-based application designed to detect eye blinks using Electrooculography (EOG) signals and translate them into keystrokes. The application leverages the Lab Streaming Layer (LSL) protocol to acquire real-time EOG data, processes the signal to detect blinks, and simulates a spacebar press whenever a blink is detected. The application is built using the tkinter library for the graphical user interface (GUI) and integrates with pyautogui for keystroke emulation.
Features#
Features |
Description |
|---|---|
|
|
|
|
|
|
|
|
A small window appears in the corner, displaying a Connect button. Once connected, a Start button becomes visible. Pressing the Start button initiates blink detection, and each detected blink triggers a spacebar key press.
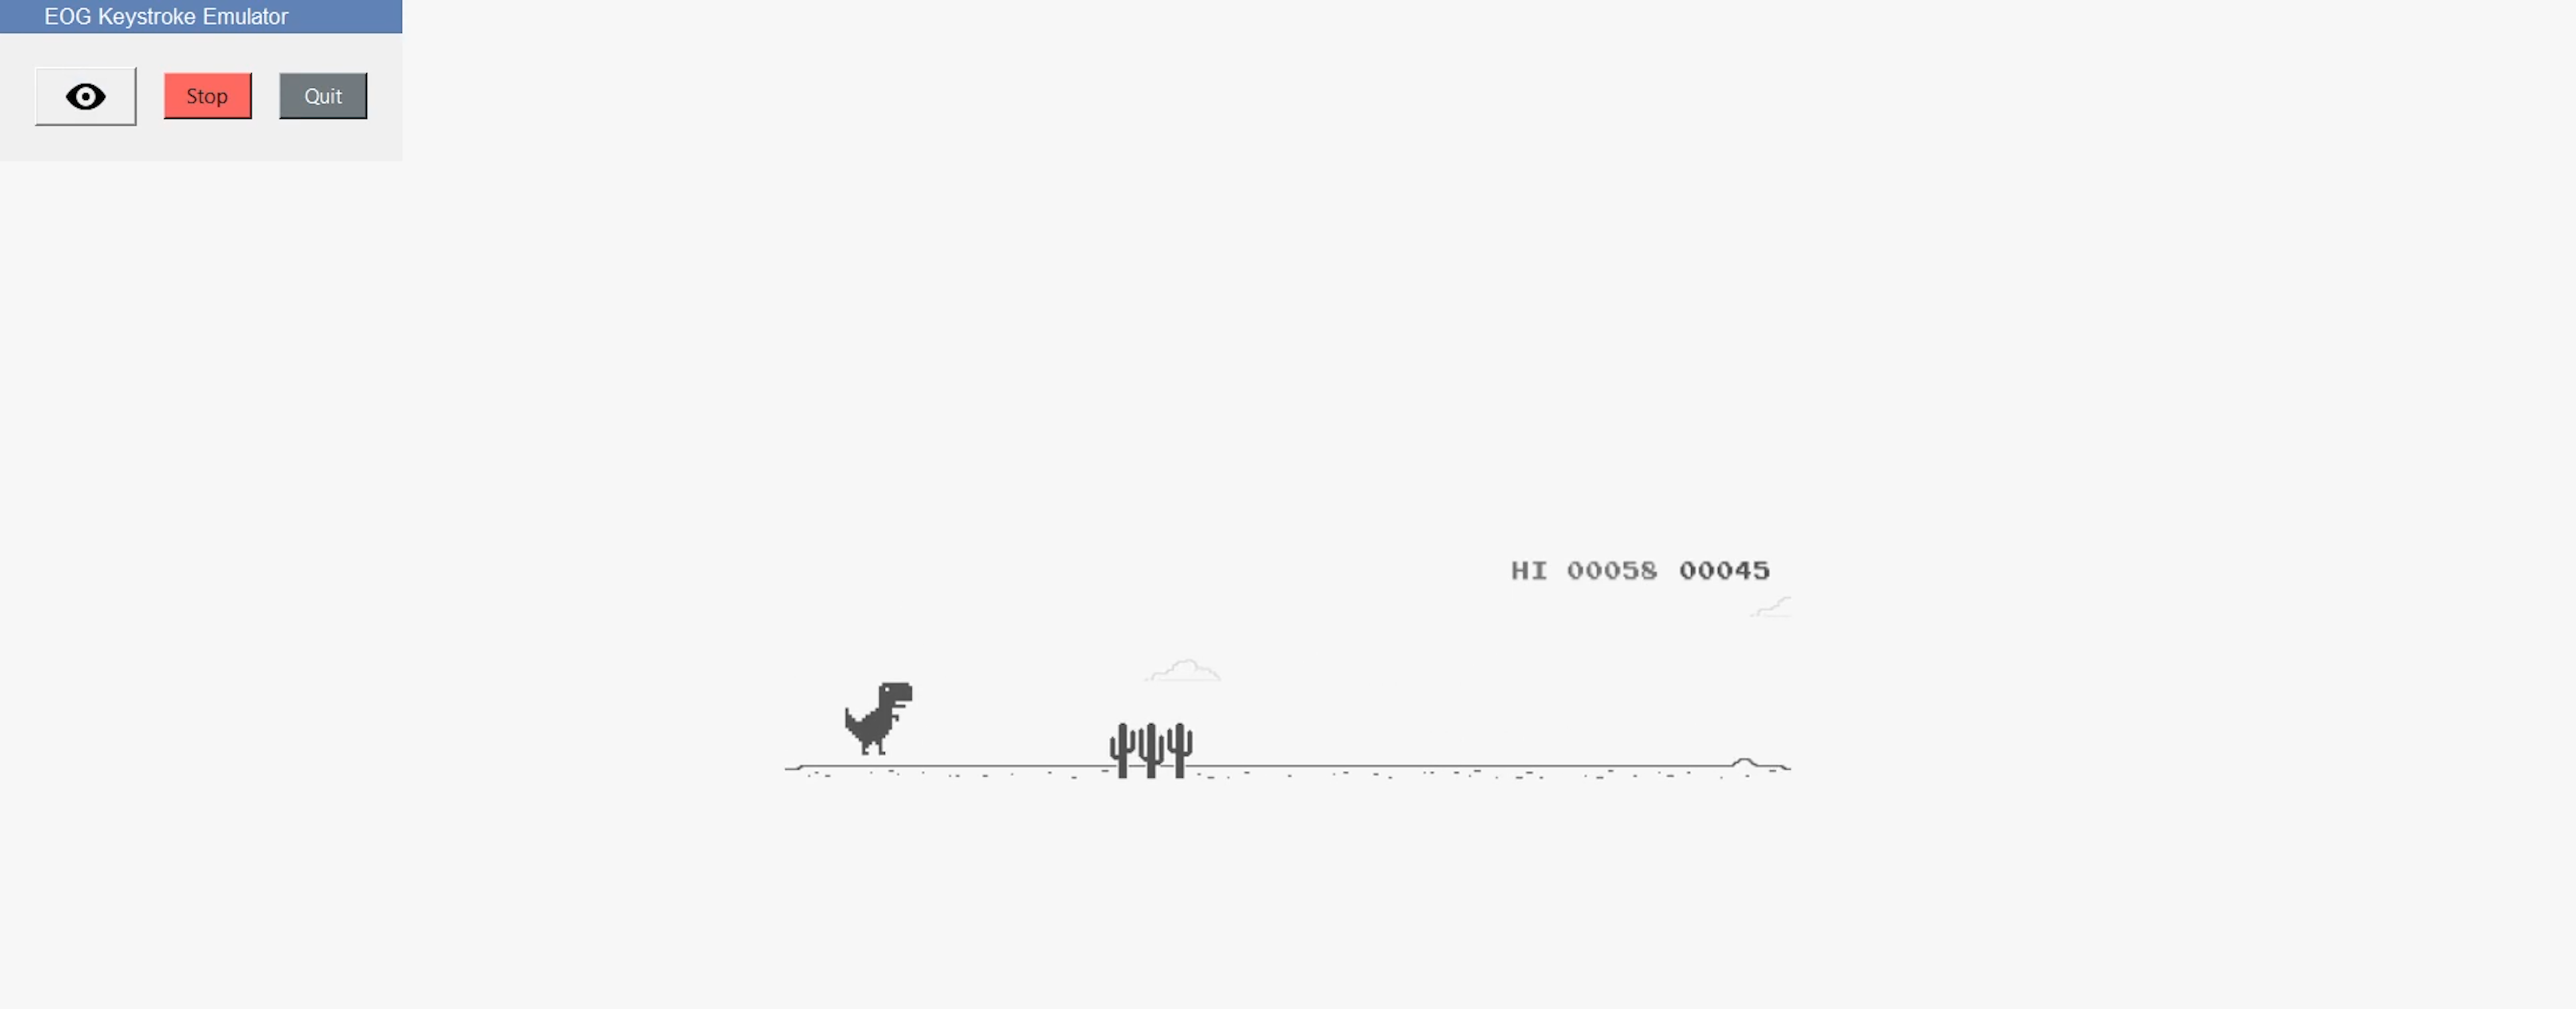
Keystroke Emulator#
9. CSV Plotter#
Overview#
The CSV Plotter is a Python-based application designed to visualize data from CSV files. Built using the tkinter library for the graphical user interface (GUI) and plotly for data visualization, this tool allows users to load CSV files, select specific data channels, and generate interactive line plots.
Features#
Features |
Description |
|---|---|
|
|
|
|
|
|
|
|
A small pop-up will appear, providing options to load the file, select the channel, and plot the data.
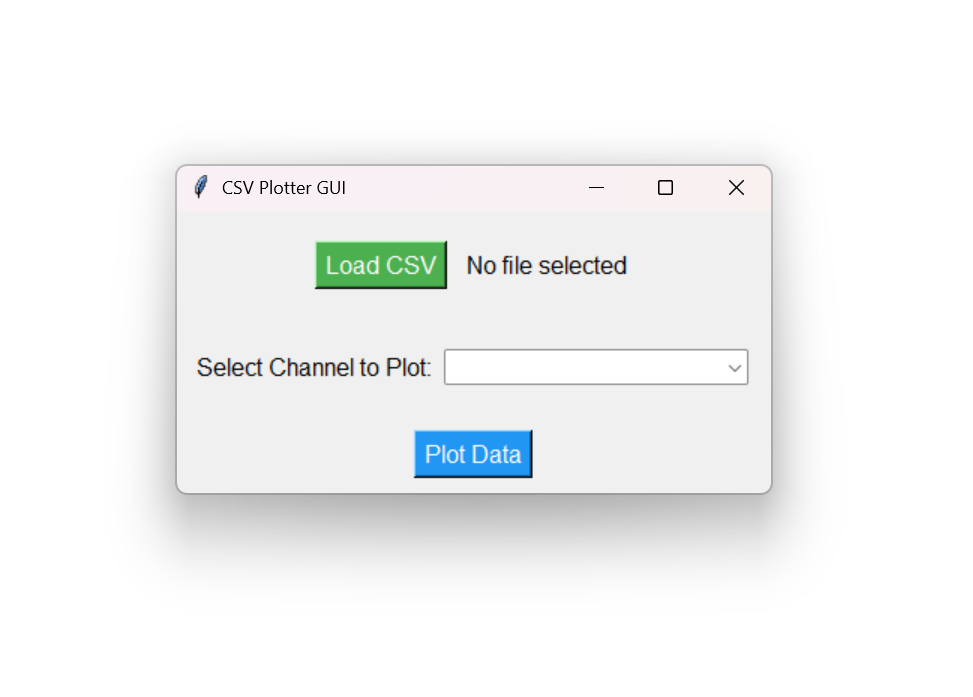
CSV Plotter#
10. EOG Morse Decoder#
Overview#
The EOG Morse Decoder is a Python-based application that enables users to input Morse code using eye movements detected via Electrooculography (EOG) signals. By moving your eyes left or right, you can generate dots and dashes, and by performing double or triple blinks, you can send characters or backspace. This application is ideal for hands-free communication and accessibility research.

Morse Decoder#
Features#
Features |
Description |
|---|---|
|
|
|
|
|
|
|
|
|
|
A GUI window will appear that allows you to input Morse code using eye movements and displays the decoded text in real-time.
Electrode Placement#
Proper electrode placement is crucial for accurate EOG signal detection. The table below shows the recommended electrode configuration:
Electrode Pin |
Description |
Placement |
|---|---|---|
A0P |
Channel 1 Positive |
Below eye |
A0N |
Channel 1 Negative |
Above eye |
A1P |
Channel 2 Positive |
On the left of left eye |
A1N |
Channel 2 Negative |
On the right of right eye |
REF |
Reference |
Bony part behind the ear |
Note
Channel 1 (A0P/A0N) detects vertical eye movements for blink detection
Channel 2 (A1P/A1N) detects horizontal eye movements for left/right detection
Proper skin preparation and electrode contact quality are essential for optimal performance
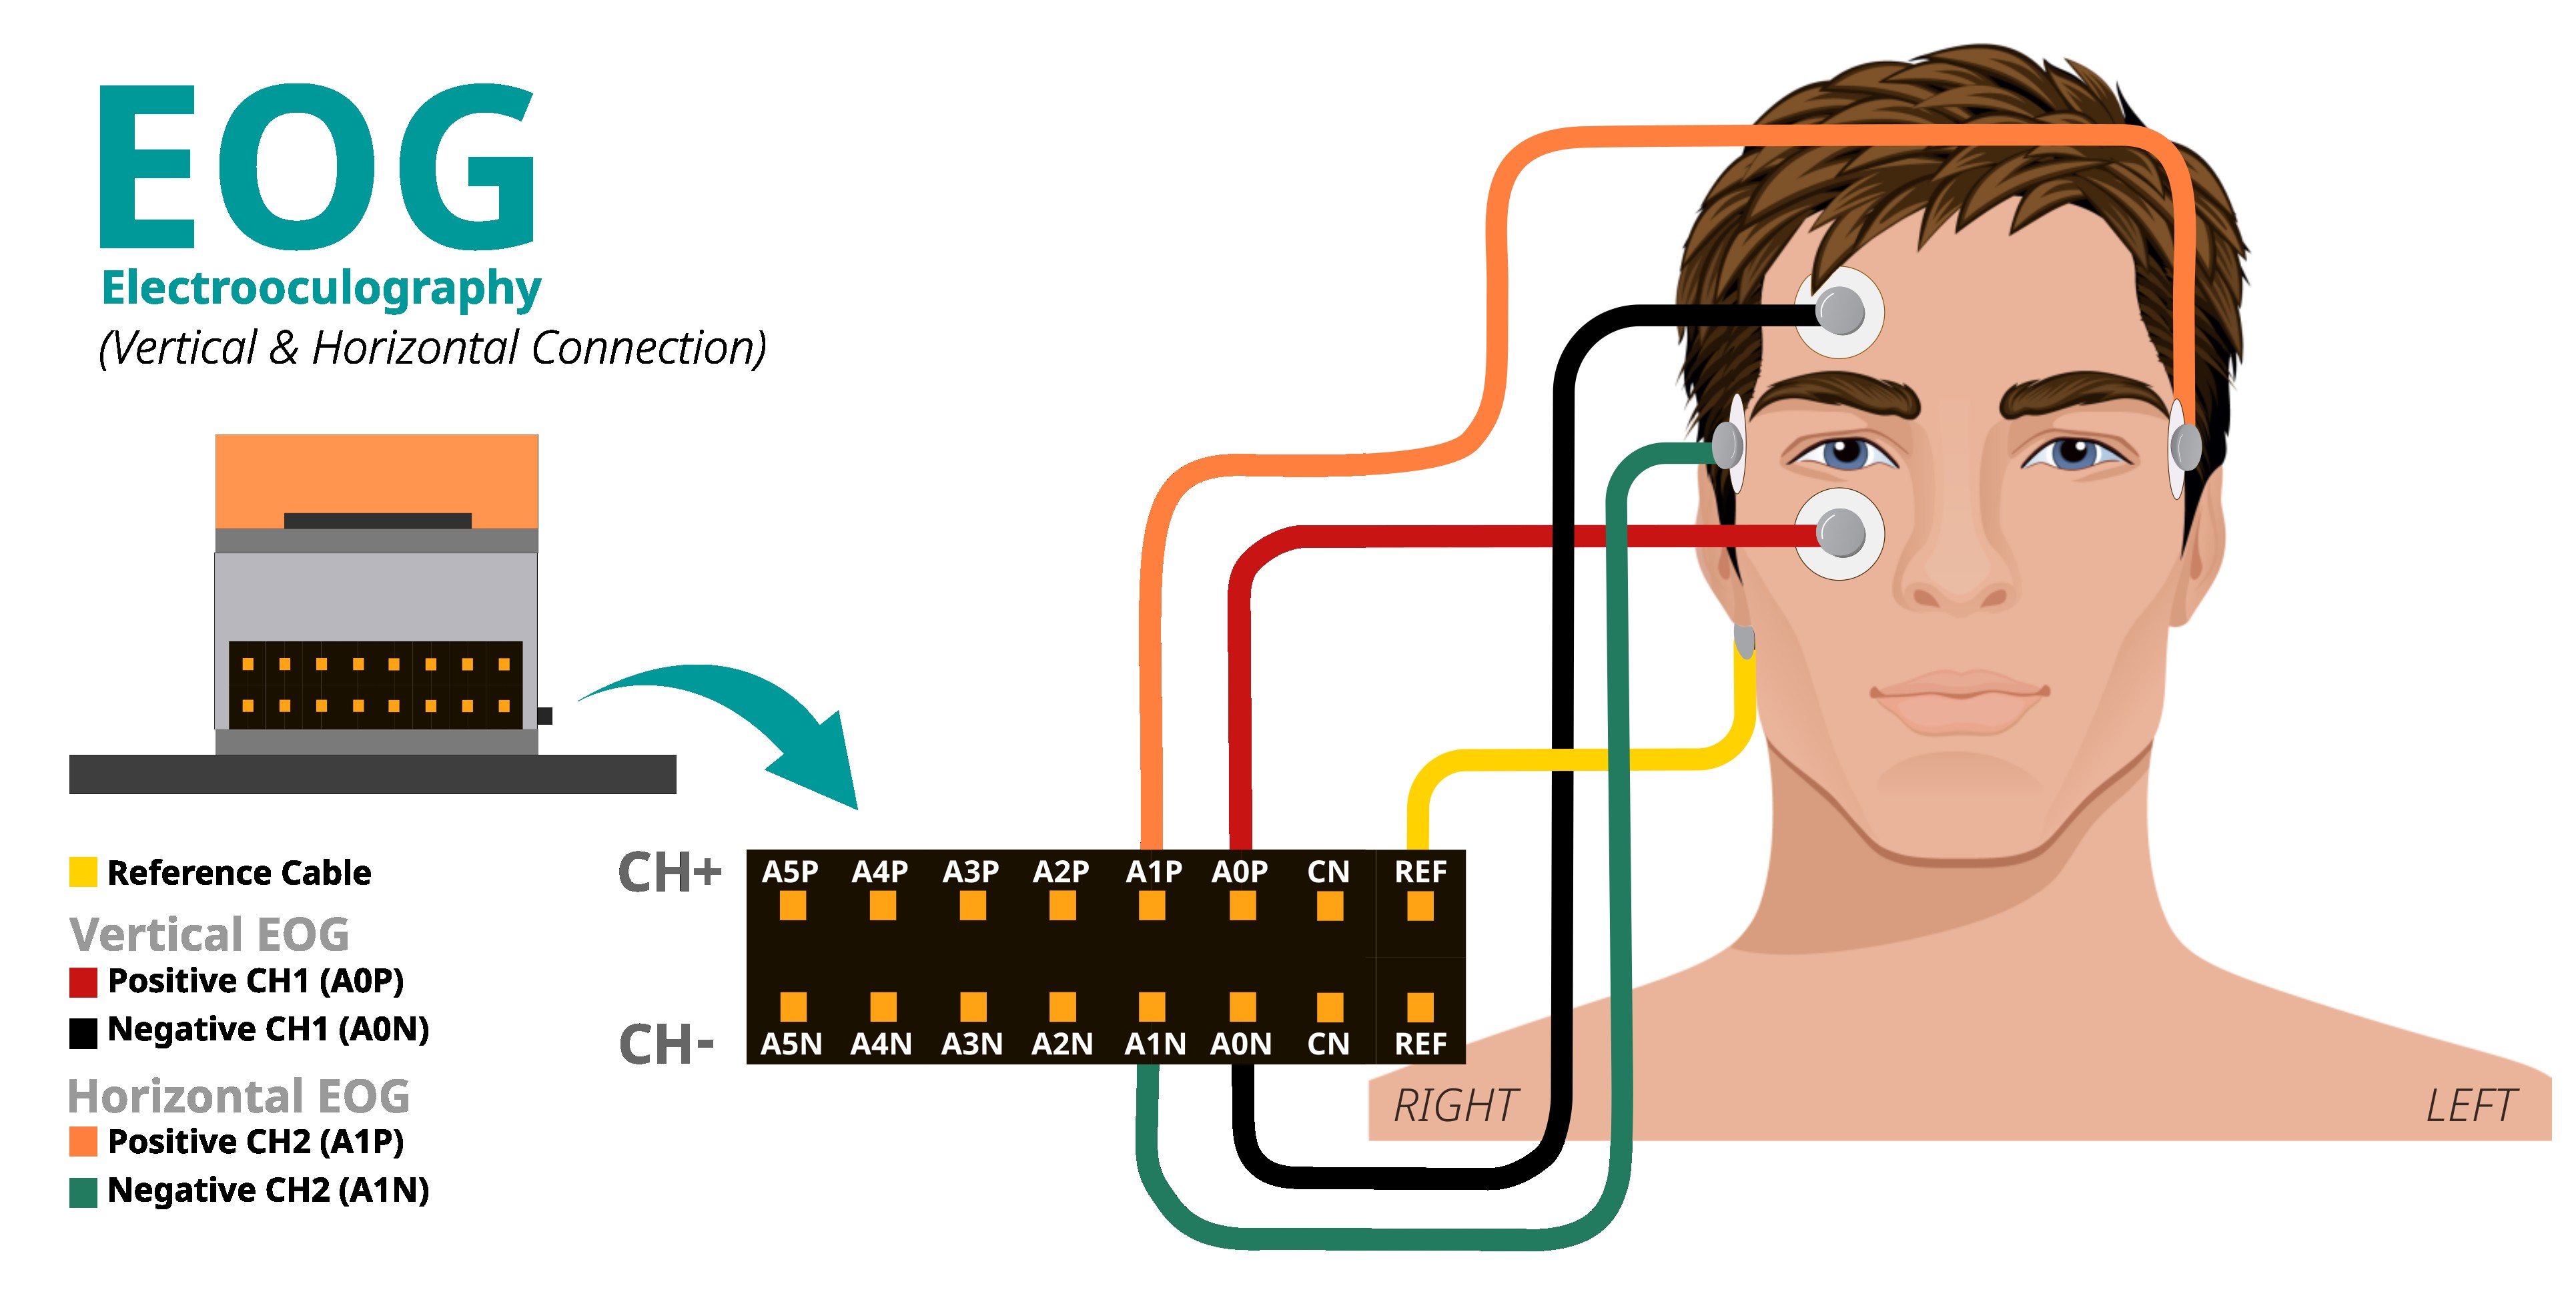
Electrode Placement Diagram#
How It Works#
Signal Acquisition: The application connects to an LSL stream and continuously reads vertical and horizontal EOG data from two channels.
Filtering: Notch filters (50Hz), high-pass filters (1Hz), and low-pass filters (10Hz) are applied to remove powerline interference and isolate relevant frequencies.
Baseline Tracking: A rolling baseline is maintained for horizontal EOG to adapt to individual signal characteristics.
Envelope Detection: Vertical EOG signal envelope is computed for reliable blink detection.
Movement Detection: Horizontal EOG deviations from baseline are analyzed to classify left and right eye movements.
Morse Code Input:
Left eye movement → Dot (.)
Right eye movement → Dash (-)
Double blink → Sends the current Morse sequence as a letter
Triple blink → Backspace (deletes last character)
GUI Display: Real-time visualization shows detection thresholds, signal levels, buffer contents, and decoded message.
Adjusting Detection for Your Neural Signals#
The application provides an intuitive GUI for adjusting detection sensitivity in real-time:
Interactive Threshold Adjustment:
Blink Detection Threshold: Click or drag the orange marker on the blink detection bar to adjust the threshold (range: 40-260). Higher values require stronger blinks.
Eye Movement Threshold: Click or drag the orange marker on the eye movement bar to adjust the threshold (range: 40-260). Higher values require larger eye movements.
Visual Feedback:
The blink detection bar shows the current envelope value (green when below threshold, red when above)
The eye movement bar shows deviation from baseline (blue when below threshold, purple for left movement, red for right movement)
Threshold markers display the current threshold value and can be dragged for adjustment
Timing Parameters (adjustable in code if needed):
BLINK_DEBOUNCE_MS(default: 200ms): Minimum time between detecting separate blinksDOUBLE_BLINK_MS(default: 1000ms): Time window for double blink detectionTRIPLE_BLINK_MS(default: 1500ms): Time window for triple blink detectionEYE_MOVEMENT_DEBOUNCE_MS(default: 750ms): Minimum time between detecting separate eye movements
Tips for Optimal Performance:
Make sure NPG Lite is charged and not connected to a charging laptop or an AC powered device
Sit away from AC powered appliances
Ensure proper skin preparation and electrode contact quality. Read the Skin Preparation Guide for detailed instructions.
Start with default threshold values and adjust using the GUI sliders based on your signal strength
Ensure proper electrode placement for clean vertical and horizontal EOG signals
Maintain a neutral gaze position during baseline calculation at startup
Use the real-time visualization bars to monitor signal quality and adjust thresholds accordingly
Troubleshooting#
If movements are not detected reliably, use the GUI to adjust thresholds in real-time by clicking/dragging the orange markers
Ensure electrodes are placed correctly: vertical EOG above/below one eye, horizontal EOG at outer corners of both eyes
Remain relaxed and maintain a neutral gaze position during the initial baseline calculation
Check the real-time visualization bars to ensure signals are being detected properly
If blinks or movements are too sensitive, increase the respective threshold using the GUI sliders
If blinks or movements are not sensitive enough, decrease the threshold using the GUI sliders
Create Custom application#
You can create custom applications using the provided framework by following these steps:
Configure Application Metadata:
Edit the apps.yaml file in the config folder with your application details:
- title: "Your Application Title"
  icon: "path/to/your/icon.png"
  color: "your_hex_color"
  script: "path/to/{app_name}.py"
  description: "Brief description of your application"
  category: "Your Category"
Add this as a new entry in the YAML list. Replace all placeholders with your actual application details.
Note
The
iconpath should be relative to the application root directorycolorshould be in HEX format (e.g., “#FF5733”)The
scriptpath should point to your Python file
Create application script:
Create a new Python script in the main directory with your application name. The script should contain:
LSL stream connection handling to receive device data
User interface components using PyQt5/PyQtGraph
Data processing logic for incoming signals
Tip
Use the existing applications in the repository as reference implementations for: - lsl setup and data acquisition - Advanced UI layouts - Signal processing examples - Performance optimization